Introduction
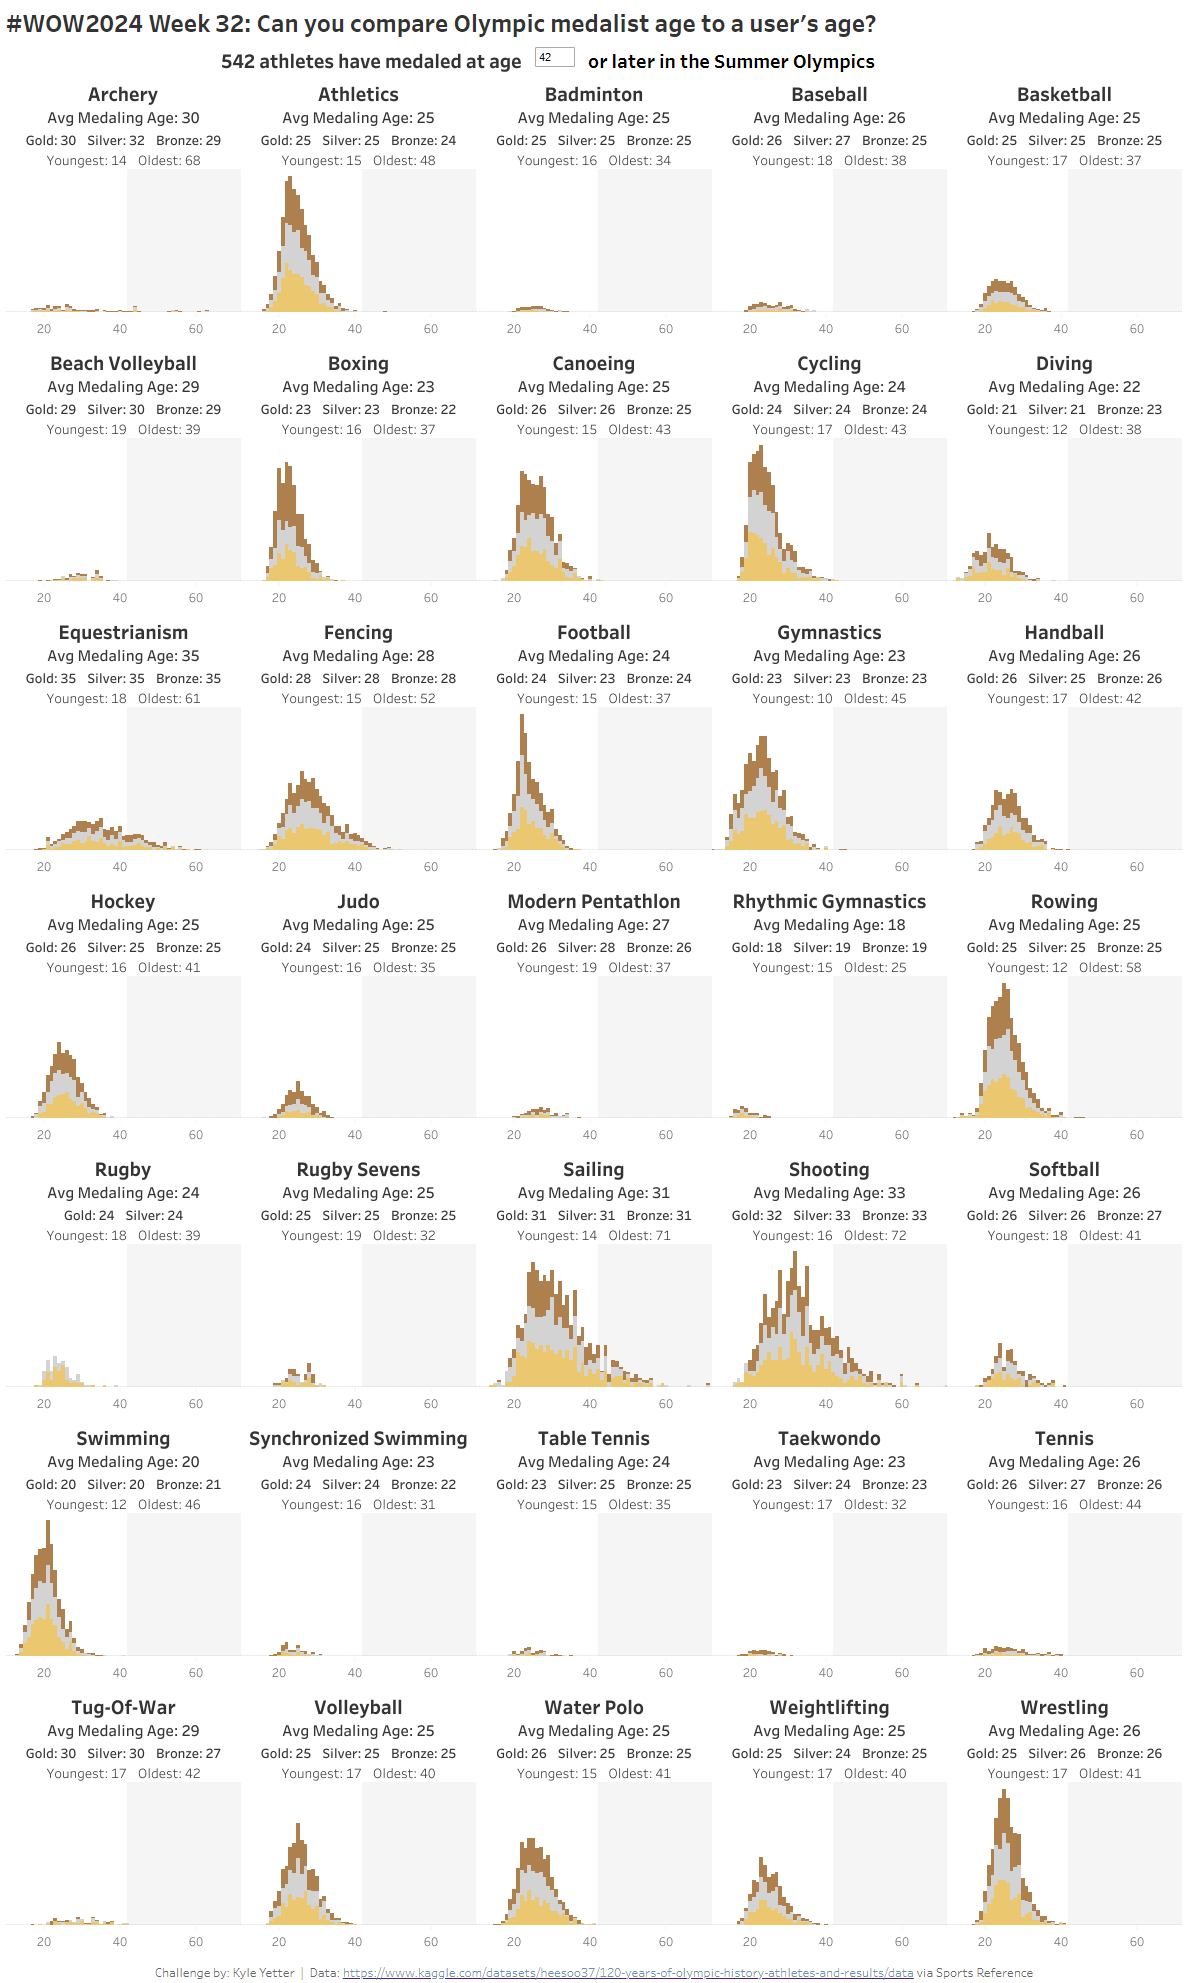
The Olympics continue this week, so we’re continuing with an Olympic theme this week as well. When thinking about a challenge, a Makeover Monday I did in 2018 came to mind (which was inspired by this viz by Rody Zakovich). But that one was the Winter Olympics, so we’re going to build a version for the Summer Olympics, looking at how old medalists in each discipline have been, with the ability to highlight an age and older, in case you want to establish a new training routine (like this US gold medalist).
Requirements
- Dashboard Size: 1200 x 2000
- Create a 5 (wide) x 7 (long) view of medalists by age by Sport, sorted alphabetically by Sport
- Header for each chart should include the Sport, average medaling age for that sport, as well as avg age by medal, and youngest/oldest medal winners
- Shade the charts so that ages greater than or equal to a parameter entry are gray
- The colors I used are:
- Gold – #f5c75f
- Silver – #d3d3d3
- Bronze – #ba7e45
- Match formatting and tooltips
It looks like a Trellis Chart, but it’s not built in one sheet. Nail the top row (formatting, tooltips, structure, etc.), then move on to the remaining rows.
Dataset
This challenge uses data from 1896-2016 Summer Olympics. You can find it here on Google Drive
Attribute
When you publish your solution on Tableau Public make sure to take the time and include a link to the original inspiration. Also include the hashtag #WOW2024 in your description to make it searchable!

Share
After you finish your workout, share on Twitter and/or LinkedIn using the hashtag #WOW2024 #Tableau and tag @WorkoutWednsday
