Introduction
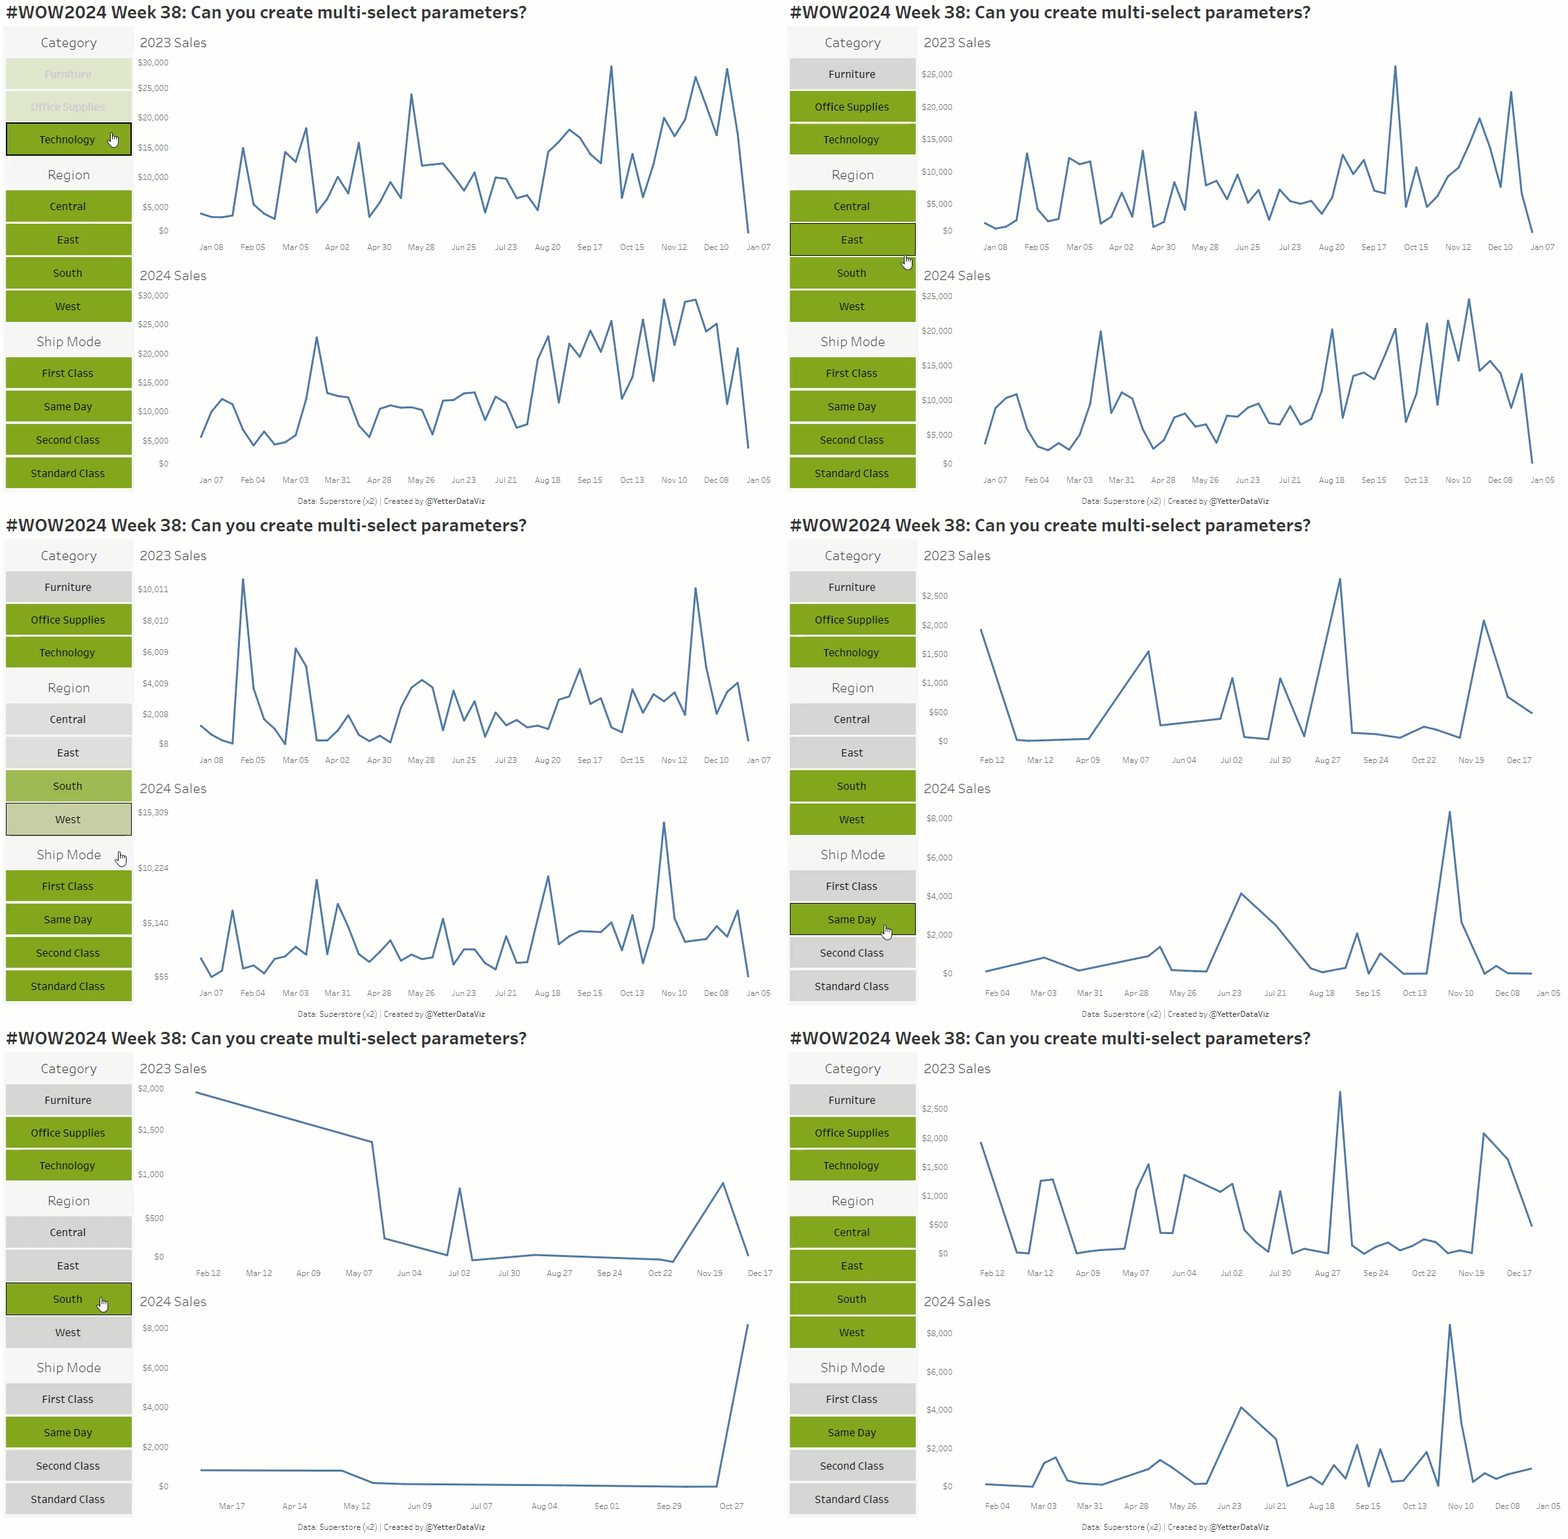
This week’s challenge again comes from trying to solve a problem in my day job, where I was exploring the possibility of parameters being multi-select like filters. We couldn’t use filters because we had different data sources, so I found a few forum and blog posts that make multi-select parameters a possibility, even if they may look a little different than multi-select filters out of the box.
Requirements
- Dashboard Size: 1200×800
- Connect to Superstore TWICE, with one filtered to 2023, and one to 2024
- Create a line chart showing Sales for each of the two data sources/years
- Create selectable filters for Category, Region, and Ship Mode that change both charts
- Default should have all items selected/highlighted, then selecting an item (or items) will highlight that item(s), and deselecting will unhighlight (unless that then goes back to all items)
Dataset
This challenge uses Superstore twice as two separate data sources, one filtered to 2023 and the other to 2024.
Attribute
When you publish your solution on Tableau Public make sure to take the time and include a link to the original inspiration. Also include the hashtag #WOW2024 in your description to make it searchable!

Share
After you finish your workout, share on Twitter and/or LinkedIn using the hashtag #WOW2024 #Tableau and tag @WorkoutWednsday


