Introduction
Hello #WOW enthusiasts, I’m Hannah, a data analyst consultant at The Information Lab. This week’s challenge is inspired by a client project I did recently, where I was trying to recreate a specific visual from a different software. I thought I could save you the headache if this kind of problem ever crossed your path. I wanted to immortalise this viz on my Public too, in case I came up against something similar in the future, save me the headache too!
Requirements
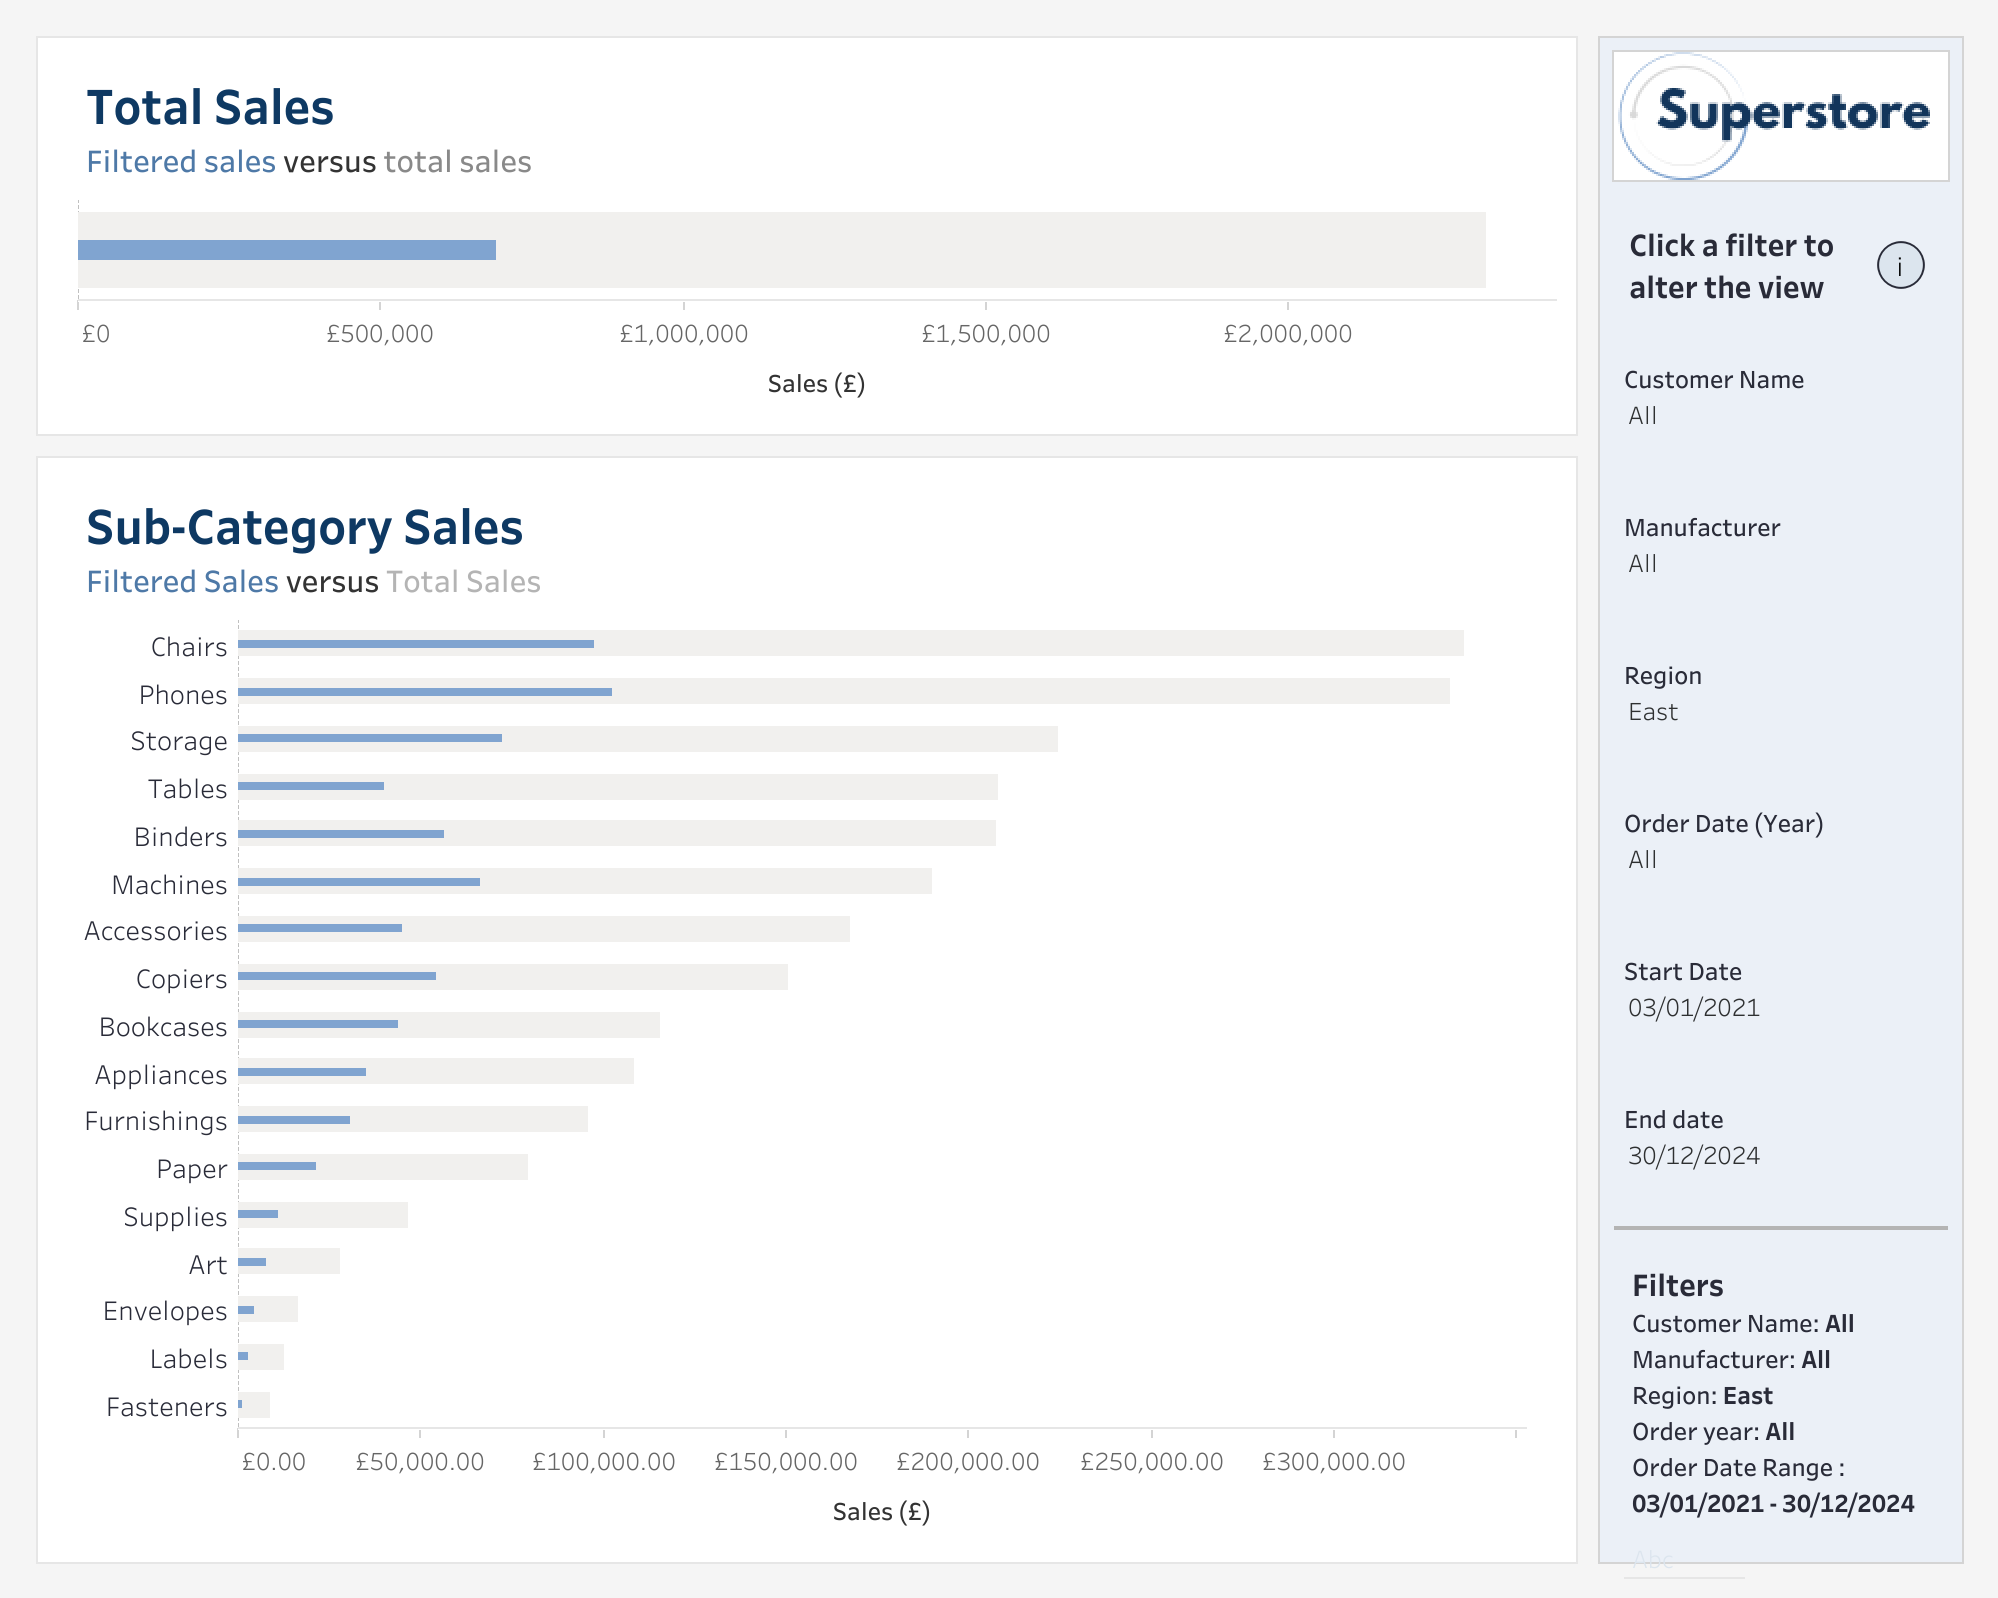
- Filters: Customer Name, Manufacturer, Region, Order Date (Year), Date range (parameters)
- Dashboard dimensions: 1000 x 800
- Calculations: 4 key measures: sub-category sales, total sales, filtered sub-category sales and filtered total sales
- Design: Superstore logo at the top of the filter pane- use mine or create your own!
Dataset
This challenge uses Sample Superstore data (2024 version) with no filters applied. You can find the data source on Data.World
Attribute
When you publish your solution on Tableau Public make sure to take the time and include a link to the original inspiration. Also include the hashtag #WOW2024 in your description to make it searchable!

Share
After you finish your workout, share on Twitter and/or LinkedIn using the hashtag #WOW2024 #Tableau and tag @WorkoutWednsday
