Introduction
Welcome to Week 16 of 2025!
Input tables are one of the coolest features of Sigma, and recently, their actions received a serious upgrade. Now, you can update or delete a row in an input table, instead of just adding a new row.
This week, you will be using sample housing data from Denver to make a small data app that allows you to practice implementing these new actions.
Good Luck!
-Ashley
Need access to Sigma?
Note: You will only have view access to WOW Workbooks, Folders, and Workspaces, not edit access. Please create your WOW Workbooks under “My Documents.” We suggest creating a folder to organize all your workbooks.
Requirements
- On a hidden Data Tab:
- First, we want to add our source data into an empty Input Table. This data is in a CSV that can be downloaded from Google Drive: Denver Neighborhood Data Sample
- Add a Row ID column
- Add 2 calculated columns:
- [Neighborhood, City]: Concatenate the Neighborhood and City columns
- [Has Neighborhood Info]: Return False if no information other than a name is available. If other information is found, return True.
- Format the 3 percentage columns as a percentage.
- First, we want to add our source data into an empty Input Table. This data is in a CSV that can be downloaded from Google Drive: Denver Neighborhood Data Sample
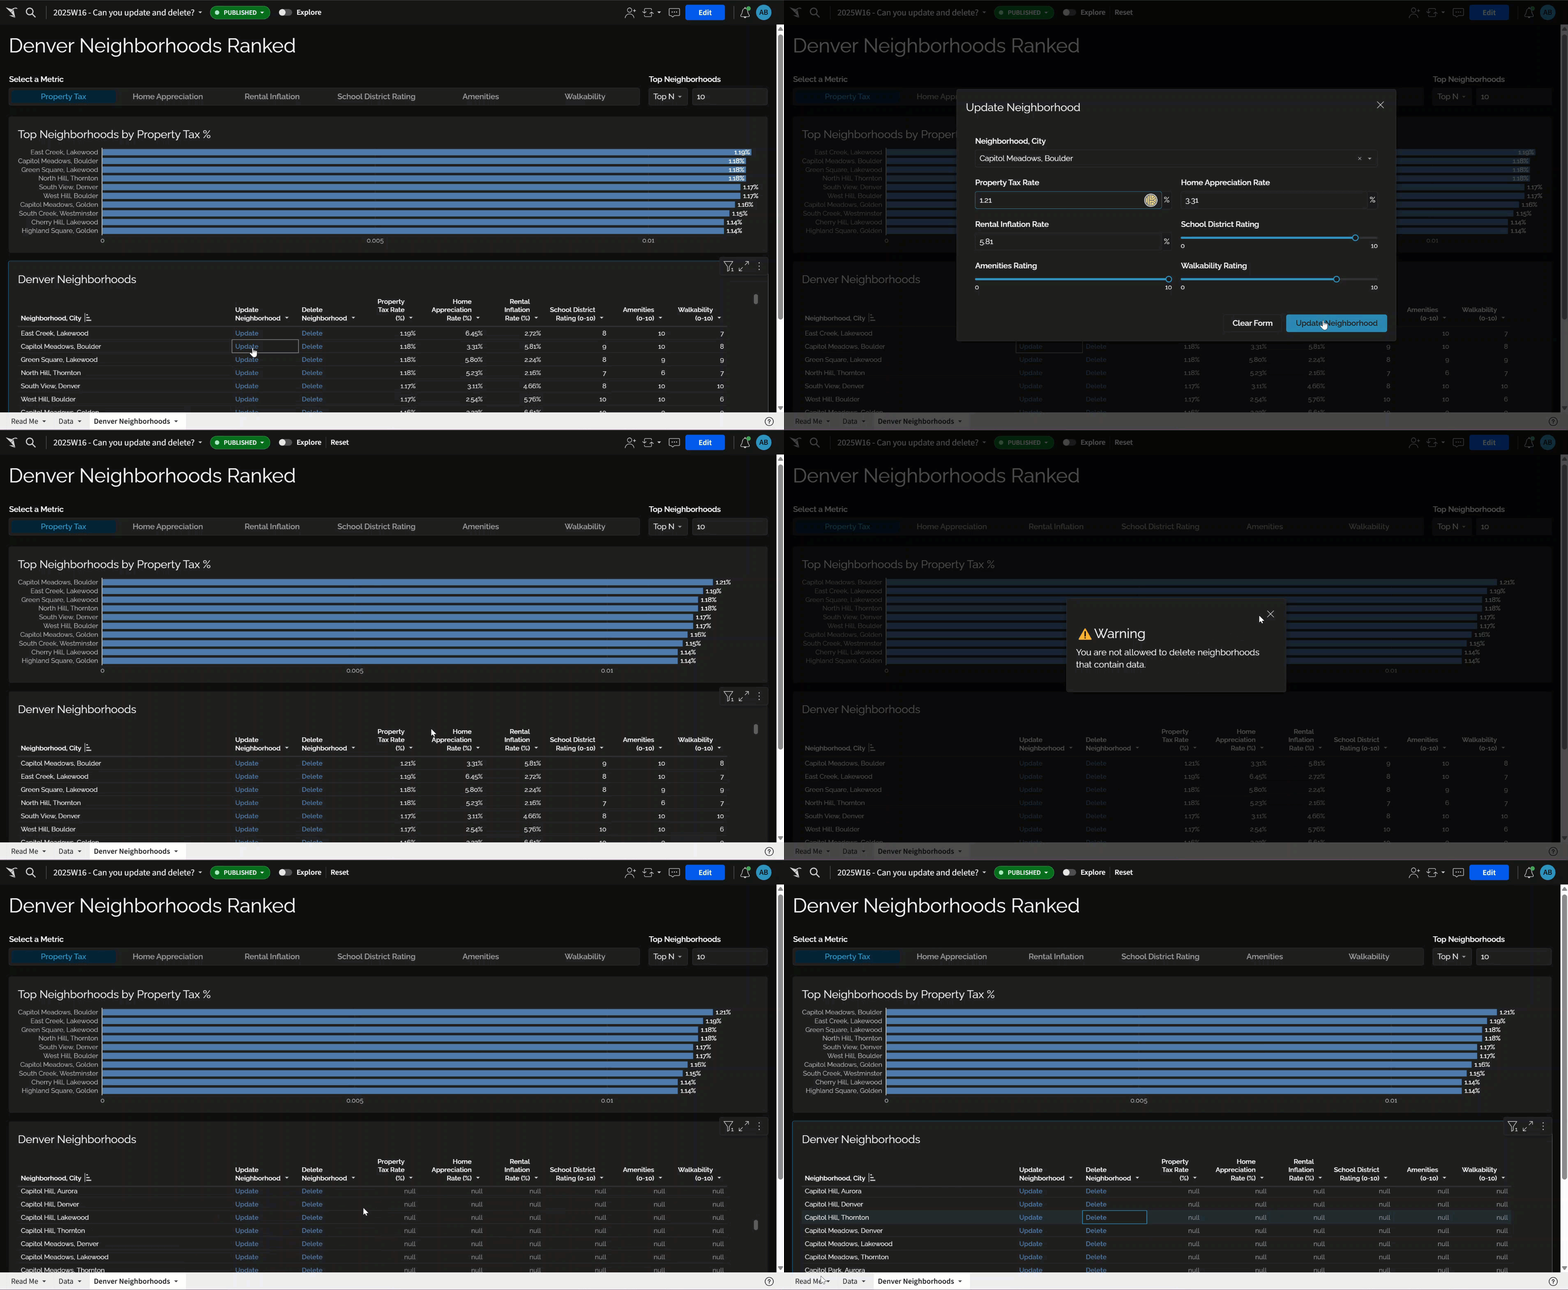
- On a new Modal,
- Create controls for each necessary column input column. No targets are required for these controls:
- Neighborhood, City:
- List Type control
- Do not allow multi-select, null values, or show histogram
- On change, lookup the existing values and input them into the other controls
- Property Tax Rate:
- Number input
- Input as a percentage
- Home Appreciation Rate:
- Number input
- Input as a percentage
- Rental Inflation Rate:
- Number input
- Input as a percentage
- School District Rating: Slider with inputs 0-10
- Amenities Rating: Slider with inputs 0-10
- Walkability Rating: Slider with inputs 0-10
- Neighborhood, City:
- Title: Update Neighborhood
- Footer Buttons:
- Primary: Update Neighborhood
- Action should update the correct row when the Neighborhood, City control is not null and close the modal
- Secondary: Clear Form
- Action should clear all controls on this modal
- Primary: Update Neighborhood
- Create controls for each necessary column input column. No targets are required for these controls:
- On a second modal, create a Warning that alerts users they are not allowed to delete neighborhoods where information exists. No buttons are needed
- On a visible tab:
- Create a Segmented page control without targets and is labeled “Select a Metric” that has the following options:
- Property Tax
- Home Appreciation
- Rental Inflation
- School District Rating
- Amenities
- Walkability
- Create a table whose parent is the input table
- Hide the [ID], [City], [Neighborhood], and [Has Neighborhood Info] columns.
- Add a column that statically says “Update” and another that says “Delete”
- Add formatting to these columns, so that they appear to be links:
- Bold
- Change the text color to blue
- The Update column should set all controls on the Update Neighborhood Modal before opening it.
- The Delete column should delete the row if it does not have existing neighborhood information. If it does have neighborhood information, then open the Warning modal.
- Add formatting to these columns, so that they appear to be links:
- Add a calculated column that ranks the row based on what metric is selected by the control.
- Hide this column
- Sort the table by this column first, the Neighborhood, City column second, and neighborhoods without information always last.
- Create a horizontal bar graph, as a child of this visible table:
- Y-Axis: Neighborhood, City
- X-Axis: The metric selected in the segmented page control
- Because some of these metrics are percentages and some are whole numbers:
- Add a label that converts the metrics to text: either a whole number or a percentage with 2 decimal places + a “%”
- Add this same text value to the ToolTip
- Remove the X-Axis value from the ToolTip
- Sort this graph by the metric value
- Filter this graph to only show the Top N metric values, and convert this filter to a page control.
- Add a Dynamic title that states it shows the Top Neighborhoods by the selected metric.
- Create a Segmented page control without targets and is labeled “Select a Metric” that has the following options:
- Finishing Touches
- Give the dashboard a descriptive title
- Arrange your elements into a cohesive dashboard
- Update your workbook’s settings to give it a more personalized flair
- Set your input table to be editable in view/explore mode
- Tips
- I recommend always being sure that every element has a unique title and/or ID:
- Add a prefix to each control ID to allow developers to more easily find the correct one. Examples:
- “ctrl-” for a general control
- “un-” for an Update Neighborhood modal control
- Rename any containers as you create them
- Rename child tables with a unique name
- Add a prefix to each control ID to allow developers to more easily find the correct one. Examples:
- I recommend always being sure that every element has a unique title and/or ID:
Dataset
Share
After you finish your workout, share on LinkedIn, Sigma’s Community page, (or Twitter) using the hashtags #WOW2024 and #SigmaComputing, and tag Ashley Bennett, Eric Heidbreder, Katrina Menne, Carter Voekel, and Michal Shaffer!
Create an interactive, sharable version of your solution here.
Also, make sure to fill out the Submission Tracker so that we can count you as a participant this week to track our participation throughout the year.
