Introduction
Welcome to Week 6 of 2025!
This week, we’re going to learn how to calculate a rolling metric, or moving sum. We’re going to use some sample Marketing Data to help us assess trends over time.
We’re going to combine with some dynamic parameters to select which metric to calculate and how granular we want to be with our calculation.
Good Luck!
-Ashley
Need access to Sigma?
Note: You will only have view access to WOW Workbooks, Folders, and Workspaces, not edit access. Please create your WOW Workbooks under “My Documents.” We suggest creating a folder to organize all your workbooks.
Requirements
- On a hidden Data Tab:
- First, we want to add our source data: Sigma Sample Database / EXAMPLES / MARKETING / MARKETING_CAMPAIGN_ACTIVITY
- Note the Metrics that we will be using:
- MQLs: Sum([MQL])
- SQLs: Sum([SQL])
- SALs: Sum([SAL])
- Opps: Sum([OPP])
- Open Opps: Sum([OPEN_OPP])
- Also note the corresponding date column for each of these metrics:
- MQL Date Recent
- SQL Date
- SAL Date
- Opp Created Date
- Note the Metrics that we will be using:
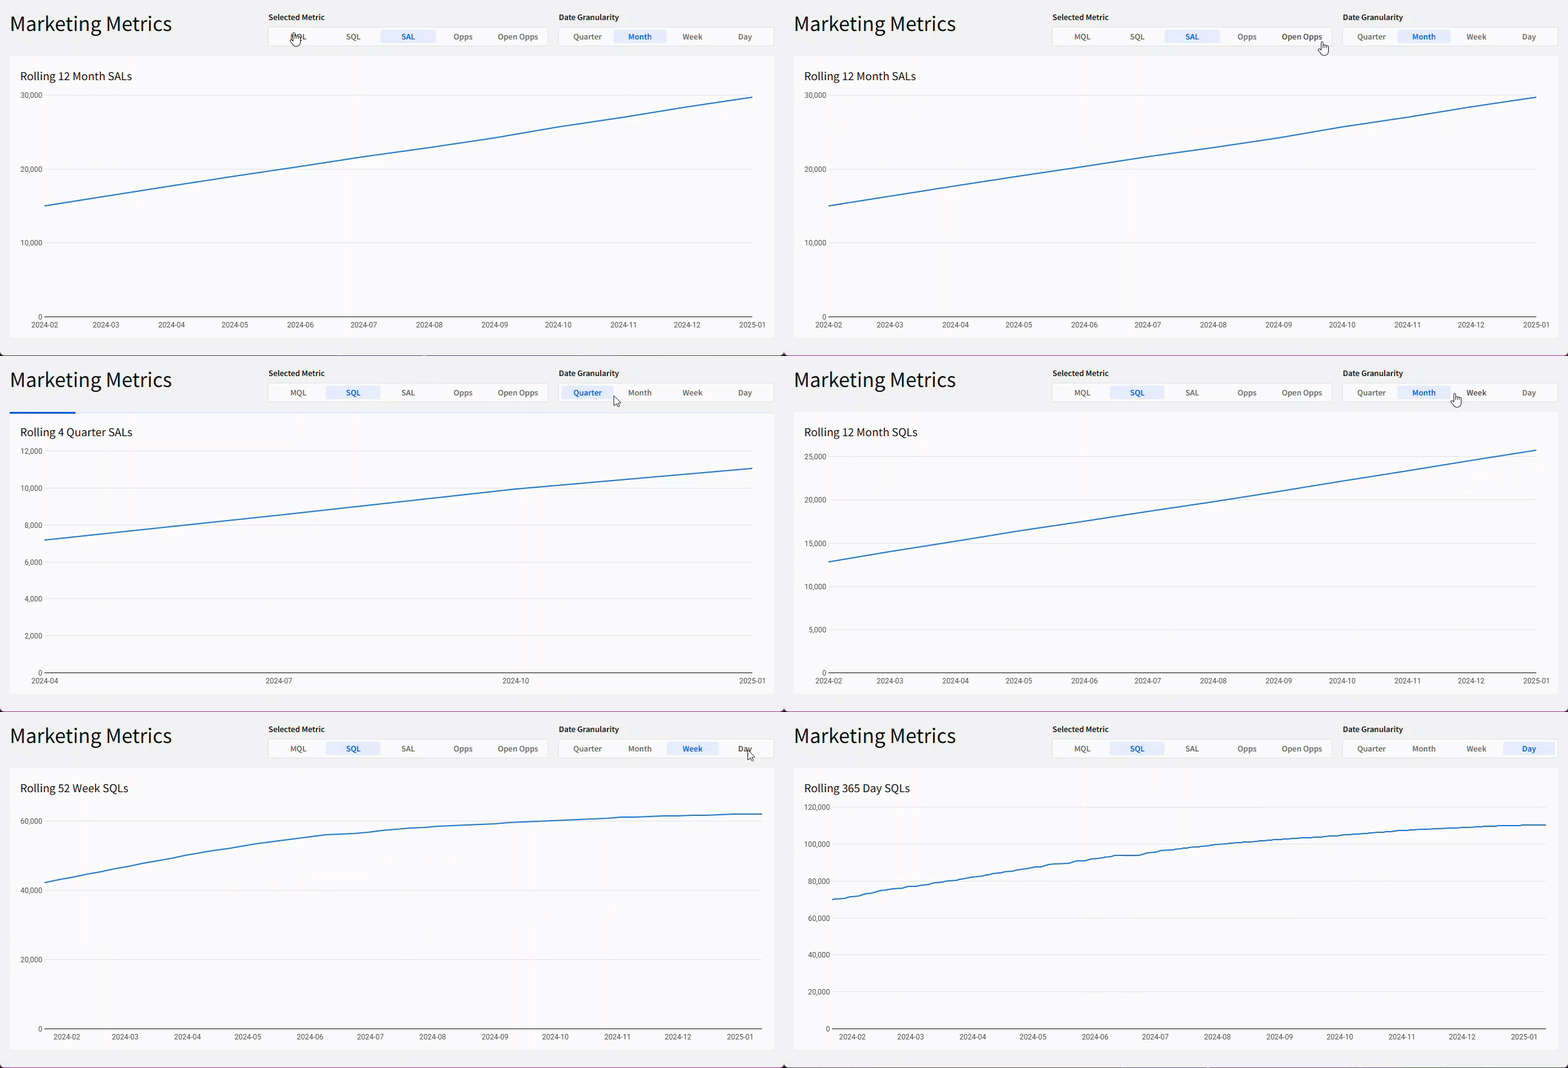
- Create 2 Segmented Page Controls:
- Selected-Metric: Allow users to choose between any of our 5 metrics
- Date-Granularity: Allow users to choose between Quarter, Month, Week, or Day
- Be sure that the Display Values show a user-friendly value, while taking note of the text values you choose. The text values will be the value that Sigma interacts with in our calculated columns.
- Note: For the Date-Granularity, you want the text value to be the same text strings that you use in a DateTrunc function, which is case-dependent.
- Now, we want to create a child table. This will serve as an intermediary table that groups our data appropriately.
- Group this table by a new column, called [Period] that truncates the date that corresponds to the [Selected-Metric] at the selected [Date-Granularity]. Collapse this grouping
- Add a new column that calculates the [Selected-Metric] for the [Period].
- Because the MovingSum function does not allow dynamic input in the above or below arguments, add 4 columns to calculate the Rolling 4, Rolling 12, Rolling 52, and Rolling 365 of the [Period Metric].
- Only include past and current data, relative to each row.
- Be sure to only include a total or 4, 12, 52, or 365 rows.
- Finally, create a calculated column that grabs the appropriate Rolling N column for the selected [Date-Granularity]:
- Quarter: Rolling 4
- Month: Rolling 12
- Week: Rolling 52
- Day: Rolling 365
- First, we want to add our source data: Sigma Sample Database / EXAMPLES / MARKETING / MARKETING_CAMPAIGN_ACTIVITY
- On a visible tab:
- Create a line graph, using our intermediary data table:
- X-Axis: Period
- Y-Axis: Rolling Metric
- ToolTip: Add a column that states the specific metric chosen
- Add a dynamic title that states which Rolling Metric you’re looking at (i.e. Rolling 12 Month MQLs)
- Filter your line graph to show the 12 months of data, excluding nulls
- Create a line graph, using our intermediary data table:
- Finishing Touches
- Give the dashboard a descriptive title
- Arrange your elements into a cohesive dashboard
- Don’t forget to move your page controls to the visible page
Dataset
- Sigma Sample Database / EXAMPLES /
- MARKETING / MARKETING_CAMPAIGN_ACTIVITY
Share
After you finish your workout, share on LinkedIn, Sigma’s Community page, (or Twitter) using the hashtags #WOW2024 and #SigmaComputing, and tag Ashley Bennett, Eric Heidbreder, Katrina Menne, and Michal Shaffer!
Create an interactive, sharable version of your solution here.
Also, make sure to fill out the Submission Tracker so that we can count you as a participant this week to track our participation throughout the year.
