#WOW2025 W12: Can you show the top X customers in EACH of the last 3 years and their contributions to Sales?

Introduction

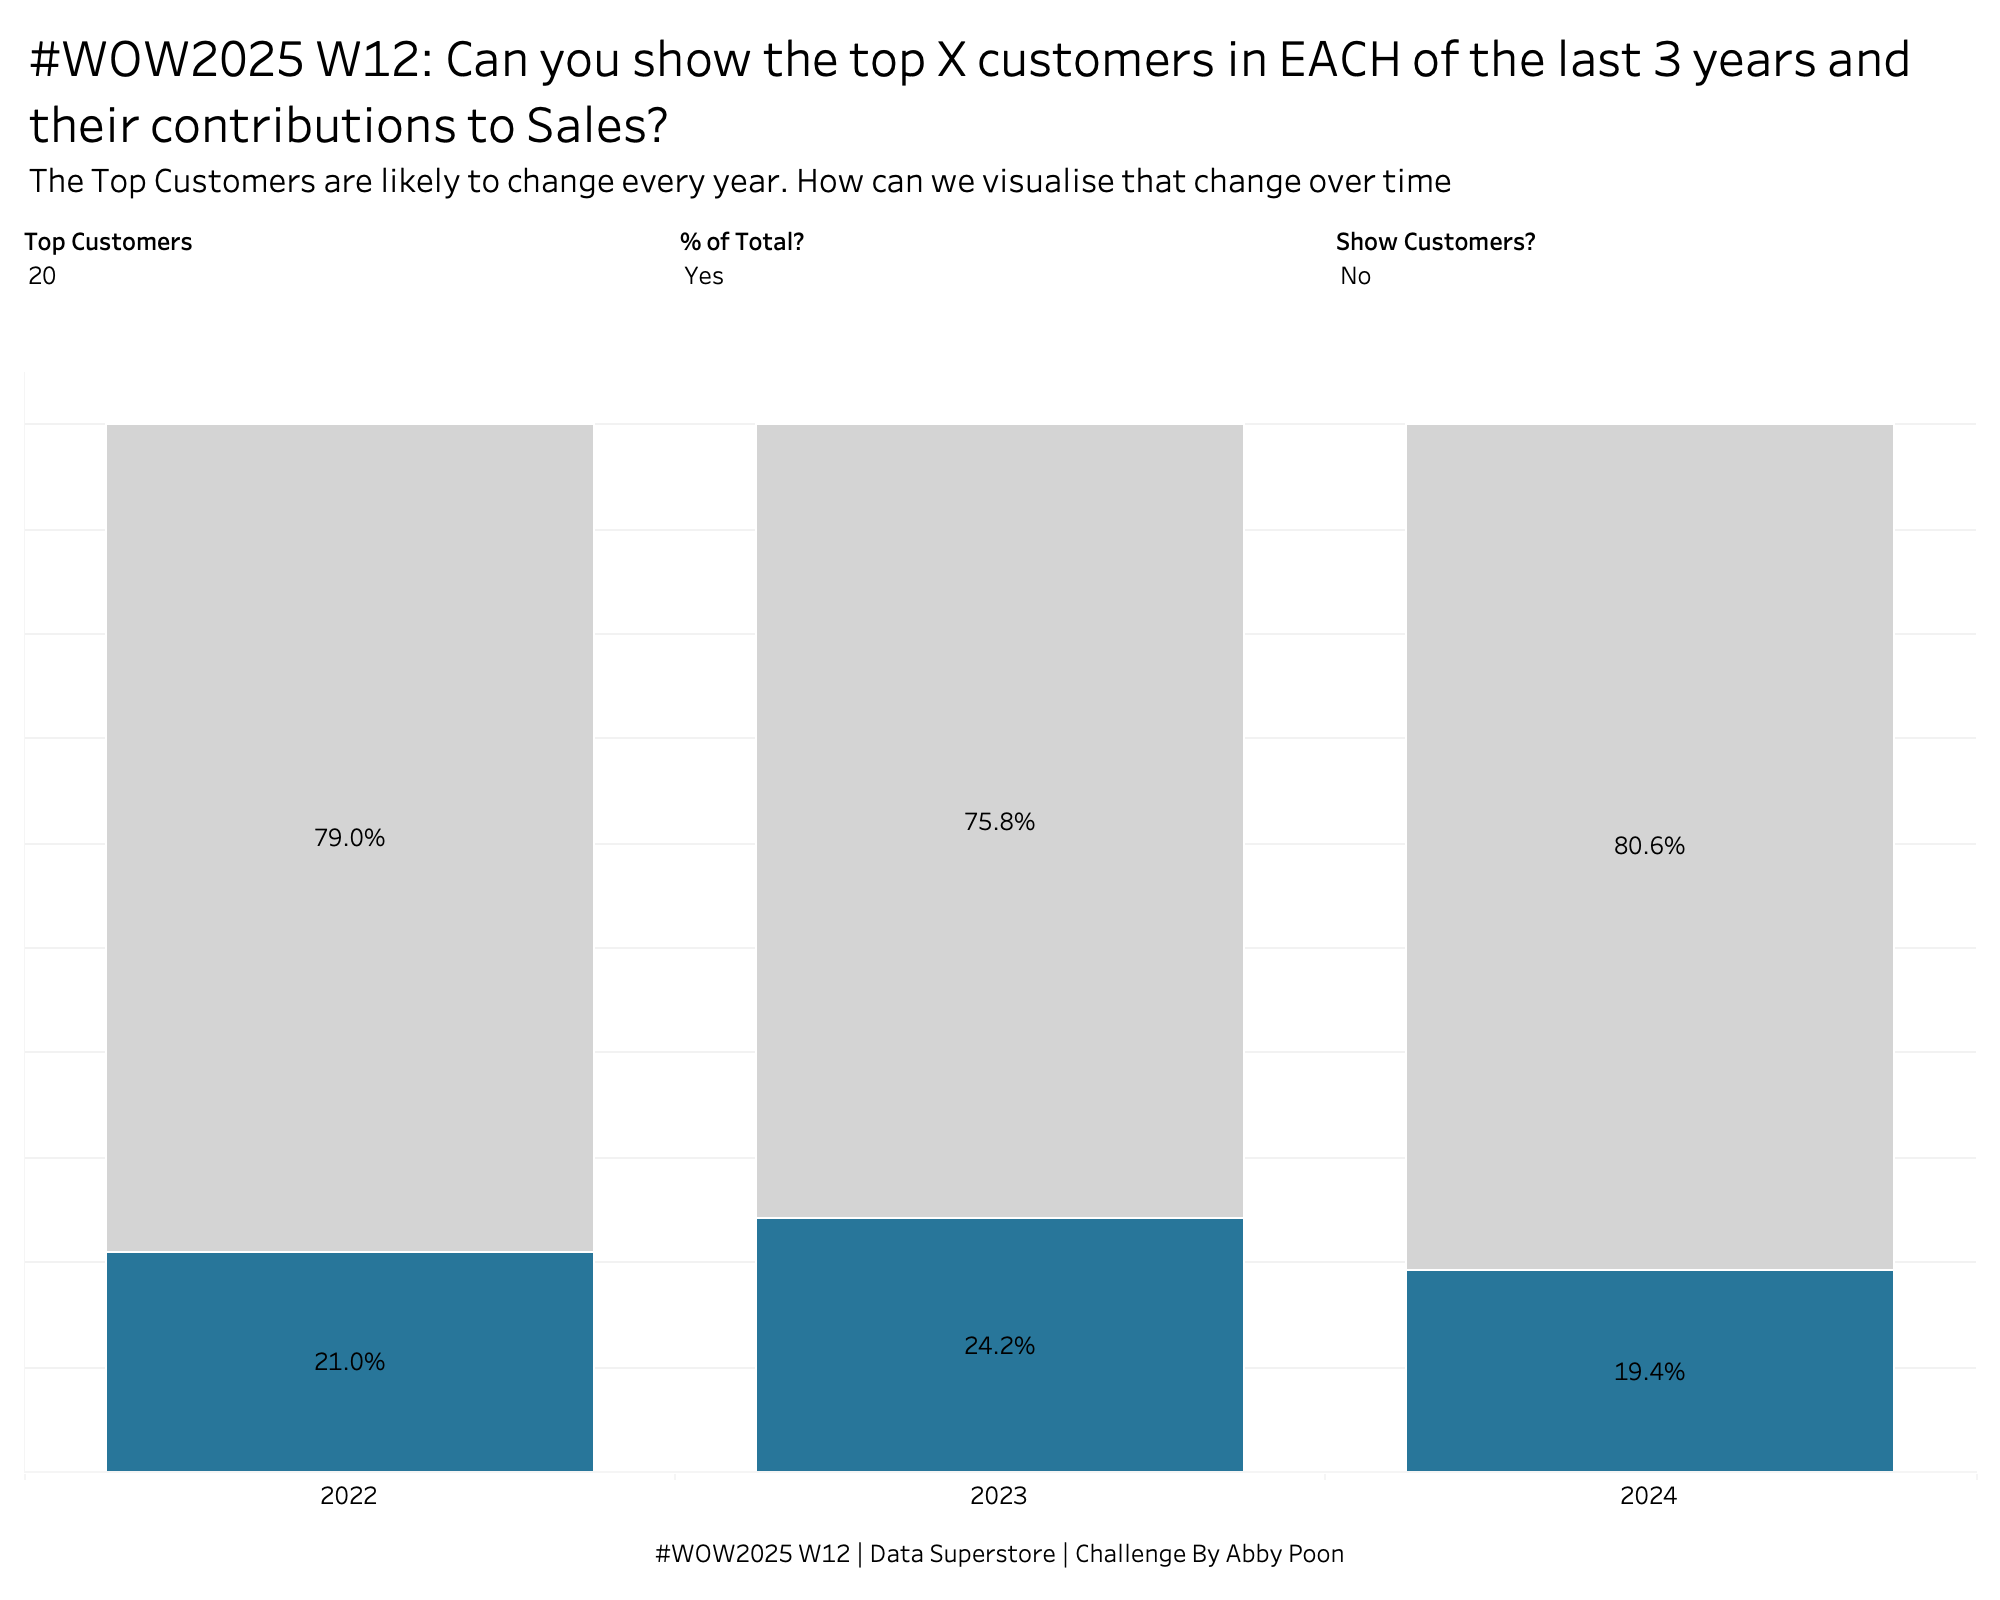
Starting the community month with a Challenge from a Data School Consultant Abby Poon. She came to me with a puzzle and we solved it together. The idea is you want to be able to see how the Top X customers are changing over the last 3 years (dynamically). Each year the top X customers might be different.

Your job is to figure out the best way to SET this up with the last 3 years dynamically

Requirements

  • Size 1000×800
  • Create a Top X customer for EACH of the last 3 years (dynamic based on MAX date)
  • Show either % of Total OR total sales
  • Give the ability to show the individual customers or as a group
  • Match Labels as the toggles switch

Dataset

Standard Superstore Available from here.

Attribute

When you publish your solution on Tableau Public make sure to take the time and include a link to the original inspiration.  Also include the hashtag #WOW2025 in your description to make it searchable!

Share

After you finish your workout, share on Twitter and/or LinkedIn using the hashtag #WOW2025 #Tableau and tag @WorkoutWednsday

Solution

Interactive

Scroll to Top