Introduction
I know what you’re thinking…”Kyle, we just did dynamically zooming maps a couple months ago!” And you’re right, we did. However, sometimes data is structured in a way we need to do some things differently. So we’re working on a different method for dynamically zooming this week, which doesn’t use spatial parameters. “But Kyle, why wouldn’t you use spatial parameters? They’re so smooth and easy to use.” Well, because I couldn’t get them to do what I wanted, so I found a different way. 🙂
Requirements
- Size 1200×900
- Create the data model using relationships. There are direct relationships between free_bike_status and vehicle_types as well as station_info and station_status. You’ll need to create a relationship between free_bike_status and station_info.
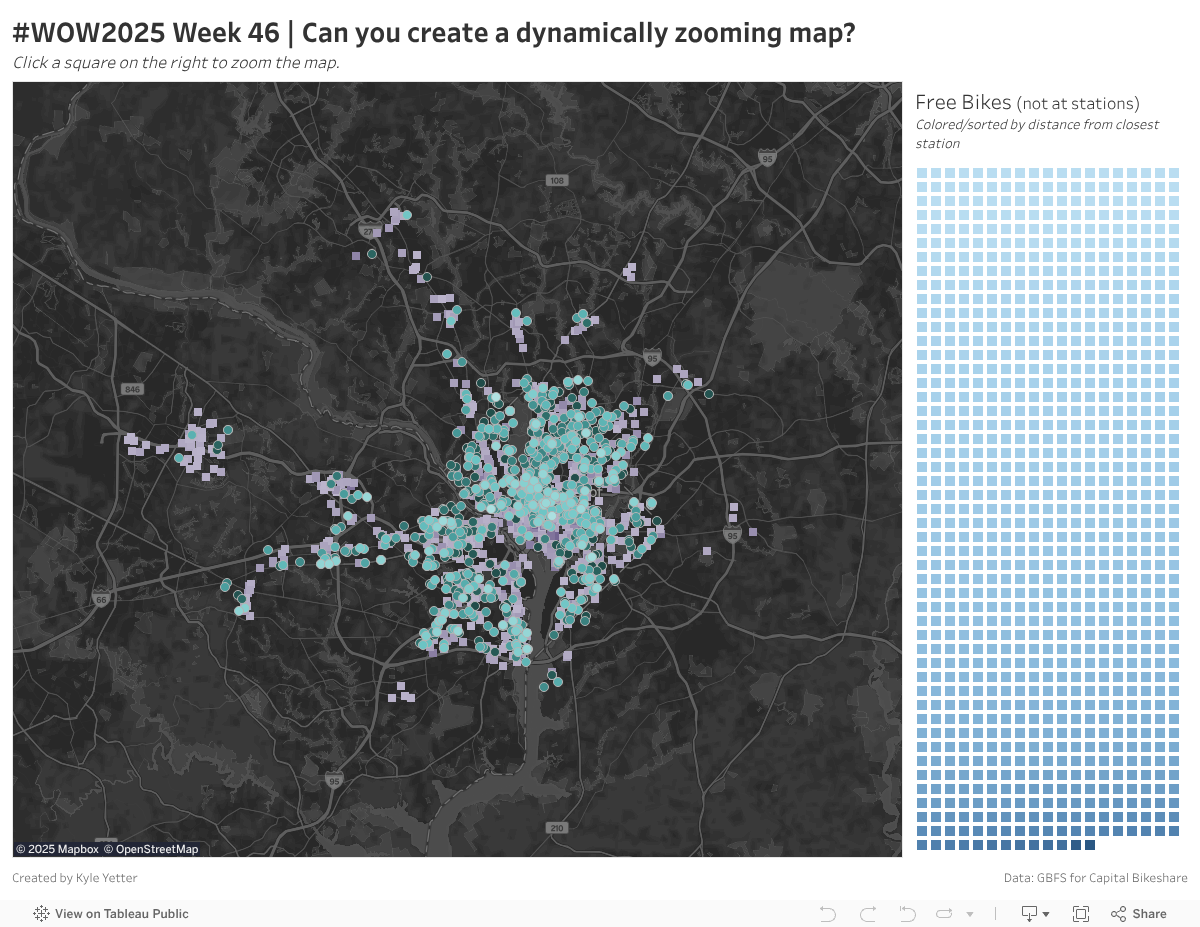
- Create a map showing free bike locations and station locations
- Bikes should be colored by charge %
- Stations should be colored by number of available bikes
- Create a box chart of all free bikes, colored/sorted by distance to the closest station
- When clicking on a box, the map should zoom to a 1000m radius from that bike location.
- When the box is deselected, the map should zoom back out to the overall view, with (38.9358,-77.1069) at its center (hint)
- Size the selected bike as a larger circle compared to others
- I customized my color ranges to avoid recalibrating upon zoom.
- Use whatever map style/color scheme you choose
Dataset
This week is a custom data set gathered via the GBFS for Capital Bike Share in Washington DC. There are 4 sheets in the file which you’ll use.
Attribute
When you publish your solution on Tableau Public make sure to take the time and include a link to the original inspiration. Also include the hashtag #WOW2025 in your description to make it searchable!

Share
After you finish your workout, share on Twitter and/or LinkedIn using the hashtag #WOW2025 #Tableau and tag @WorkoutWednsday
Solution
Interactive