Introduction
Hello and welcome to WoW week 28! This weeks topic takes it back to a fundamental lesson in CRM Analytics. I often get questions about data accuracy from users when they are comparing rows of data to the row count of a grouped chart or table. Have you ever experienced a case of “missing records” in your visuals?
Tip… check out the Tips section!
Requirements
- Navigate to the dataset found here.
- Import the dataset into your org. Name it WoW_28
- Create a new blank dashboard
- Add 3 components
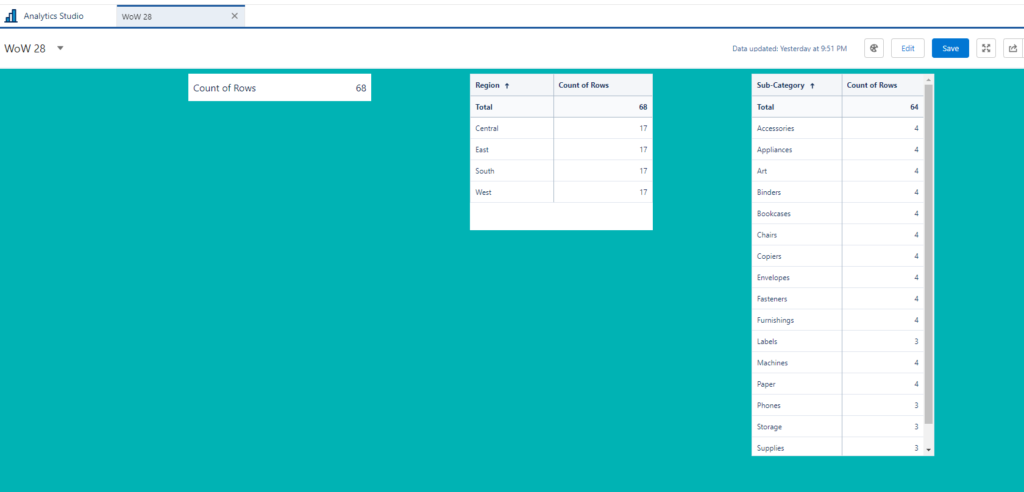
- 1. a number widget showing the count of records for dataset wow_28
- 2. a table widget, grouped by Region, showing Totals
- 3. a table widget, grouped by Sub-Category, showing totals
When using the same dataset in 3 different components, why do we get different totals? Why does the Sub-Region grouped table, have a lower record count than the other tables on the same dataset?
- Update the dataset field values to so they are accurately reflected in table groupings.

- If an external source has an entire column with null values, it will not be included in the dataset on load.
- Null field values can be updated via transformation on the dataset or at the import level on the node using default values.
- If the field type is “Measure” the null value is recognized.
Dataset
This week uses modified data from the a previous challenge. Click here to access the file on data world. If this is your first challenge, you can sign up for a dev org here: https://trailhead.salesforce.com/promo/orgs/analytics-de
Share
After you finish your workout, share a screenshot of your solutions or interesting insights on Twitter or LinkedIn using the hashtags #WOW2023 and #CRMA and tag @genetis, @PreenzJ, @LaGMills and @JaackParry. (Or you can use this handy link to do that)
Also make sure to fill out the Submission Tracker to track your progress and help us judge the difficulty of our challenges.