Introduction
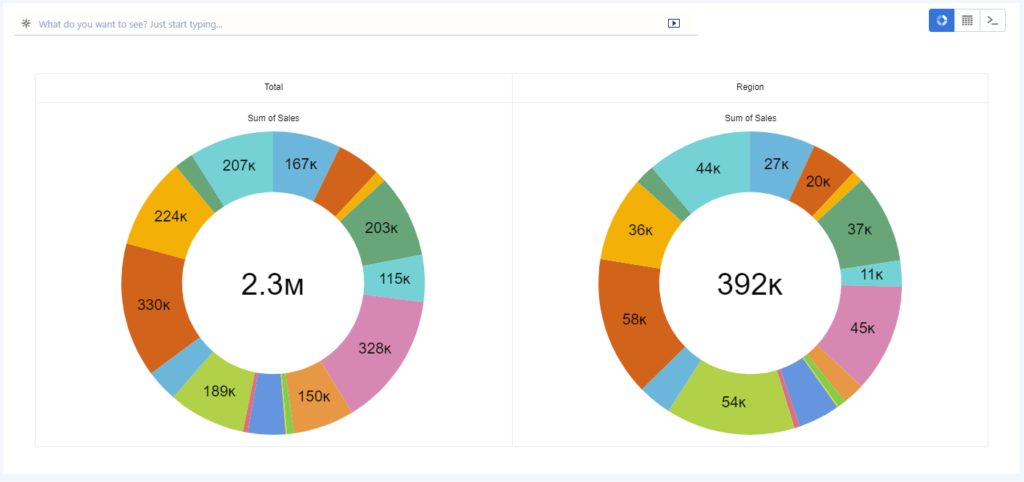
If you spent any time working with charts, you are probably aware of the controversy around pie charts. While there are some aspects to be discussed, others are generally agreed upon. One of these ones is the fact that it’s next to iimpossible to compare the slices of two pies with each other. Nevertheless, people keep trying it.  A great alternative for this use case could be slope charts. Even without highlighting, they make very clear which parts increase or decrease and indicate the magnitude of this change. At it’s core it’s just a simple line chart with only two values on the x-axis, but for this weeks challenge we’ll add a few complexities to it!
Requirements
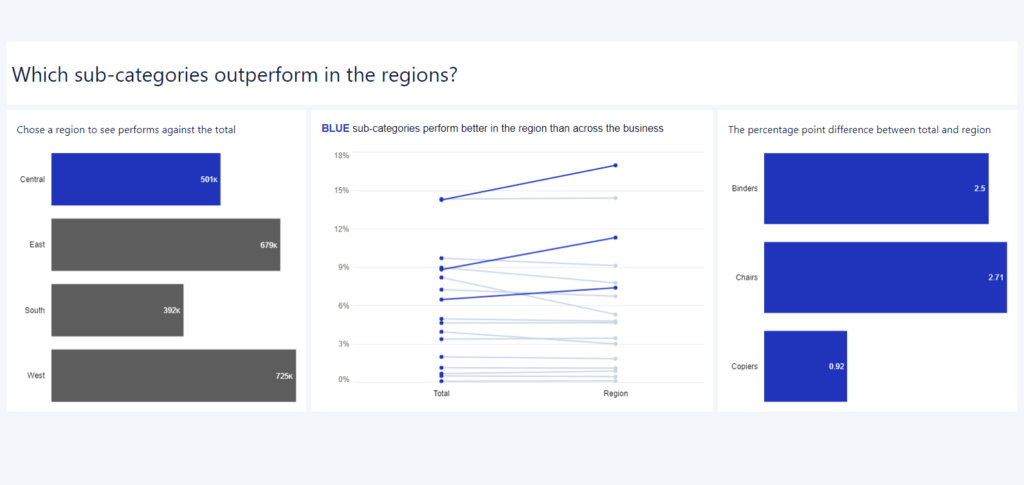
- build a recipe that allows you to create the below dashboard
- First bar chart
- Show total sales by region
- Slope chart
- show a line for each sub-category
- The value should be the percent of total sales for each sub-category
- On the left the breakdown should show for the whole business (ie. across all regions)
- on the right it should be for a single region
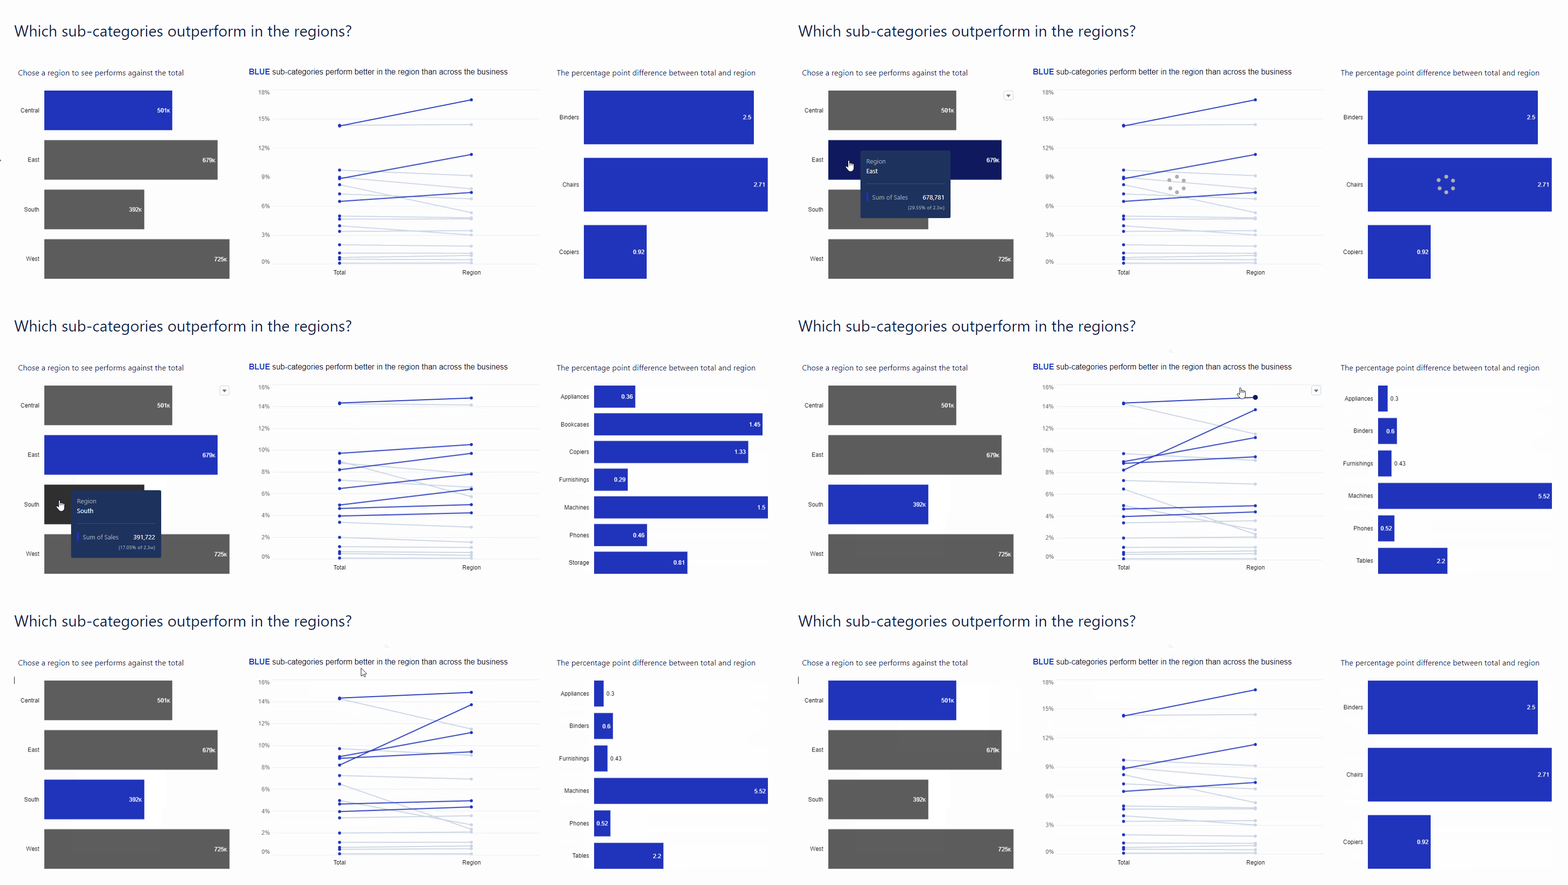
- The chart should filter to the region that is selected in the first bar chart
- Values should be displayed as percent
- All subcategories that have more than a 0.25 percent point increase should be displayed in blue, all others in grey
- Lines should have a dot on each end
- Match the tooltip
- Second bar chart
- Show the percent point difference for each subcategory that is highlighted in blue in the slope chart
- Dashboard
- Remove all legends and adjust the axis to fit the example
- Add title and descriptive text
- Match formatting of text and charts
The resulting dashboard should look something like this:


- I tried to make the logic work in SAQL, I got the query to work but I wasn’t able to build the chart afterwards as the newly created fields weren’t able to be used. I don’t know why this happened but I ended up implementing the logic in a recipe. If you get it to work in SAQL, PLEASE LET ME KNOW 🙂
Dataset
This weeks data is based off Tableaus Superstore data. I pre-aggregated it to save you a little bit of work and to avoid confusion. You can downlaod it here from data.world: https://data.world/genetis/wow-2023-27-slopechart
Share
After you finish your workout, share a screenshot of your solutions or interesting insights on Twitter or LinkedIn using the hashtags #WOW2023 and #CRMA and tag @genetis, @PreenzJ, @LaGMills and @JaackParry. (Or you can use this handy link to do that)
Also make sure to fill out the Submission Tracker to track your progress and help us judge the difficulty of our challenges.