Introduction
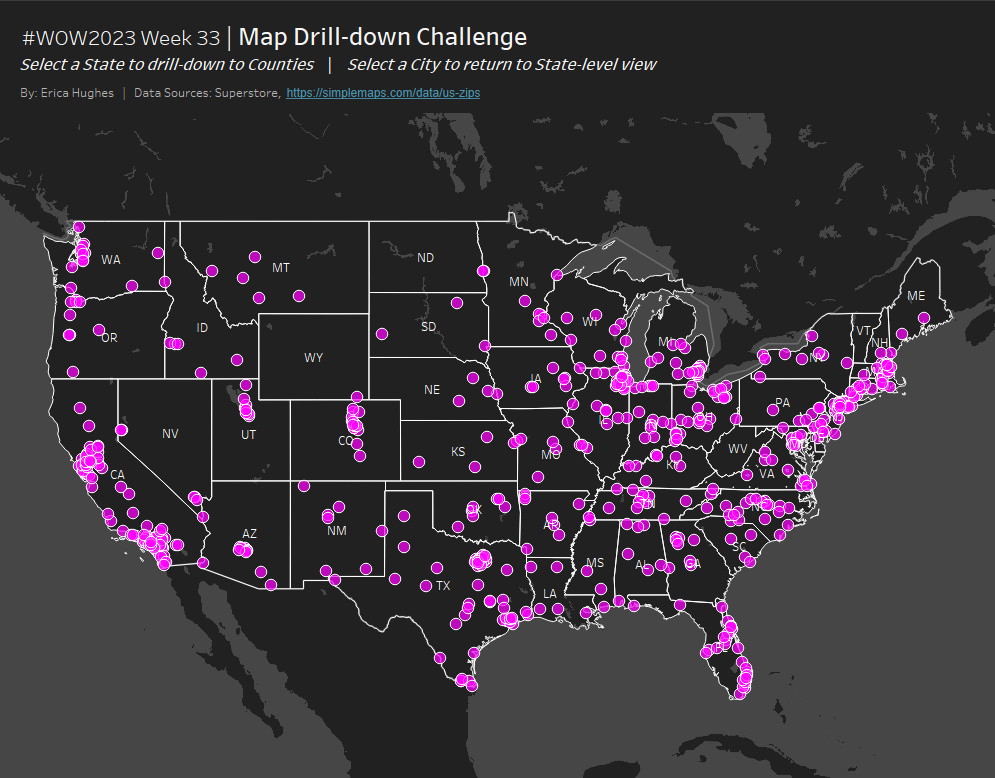
This week I have a full-on Tableau Spatial challenge for you. Just one worksheet. Minimal formatting. It’s all about the behind-the-scenes magic. Enjoy!
Requirements
- Dashboard Size: 1000 x 800px
- 1 sheet
- Create a map of the 48 ‘contigous’ (aka: mainland) US States
- Plot points for every City in the Sample Superstore data set
- Allow users to click on a State and drill-down to the County level (Note: you will need a supplementary data set to be able to plot the counties). Click on the viz for details on how this drill-down interactivity should look
- Match tooltips and formatting
Dataset
This week uses two data sources. You will need Sample Superstore (I’m using the version from 2023.2) and the following data set, containing County Names: https://simplemaps.com/data/us-zips
Note: The website states that you MUST reference this data source as shown above if you are using their ‘Basic’ version
Attribute
When you publish your solution on Tableau Public make sure to take the time and include a link to the original inspiration. Also include the hashtag #WOW2023 in your description to make it searchable!

Share
After you finish your workout, share on Twitter and/or LinkedIn using the hashtag #WOW2023 #Tableau and tag @WorkoutWednsday and @_hughej
