Introduction
What’s up everybody! Thank for checking and taking on the latest #WOW2024 challenge! I’ve got another real-life inspired challenge for you all this week. At times, it can important to show both part-to-whole relationships as well as rank or comparison to each other. We know that there are many ways to accomplish but what happens when you asked to do both with the added restriction of a reduced dashboard size?
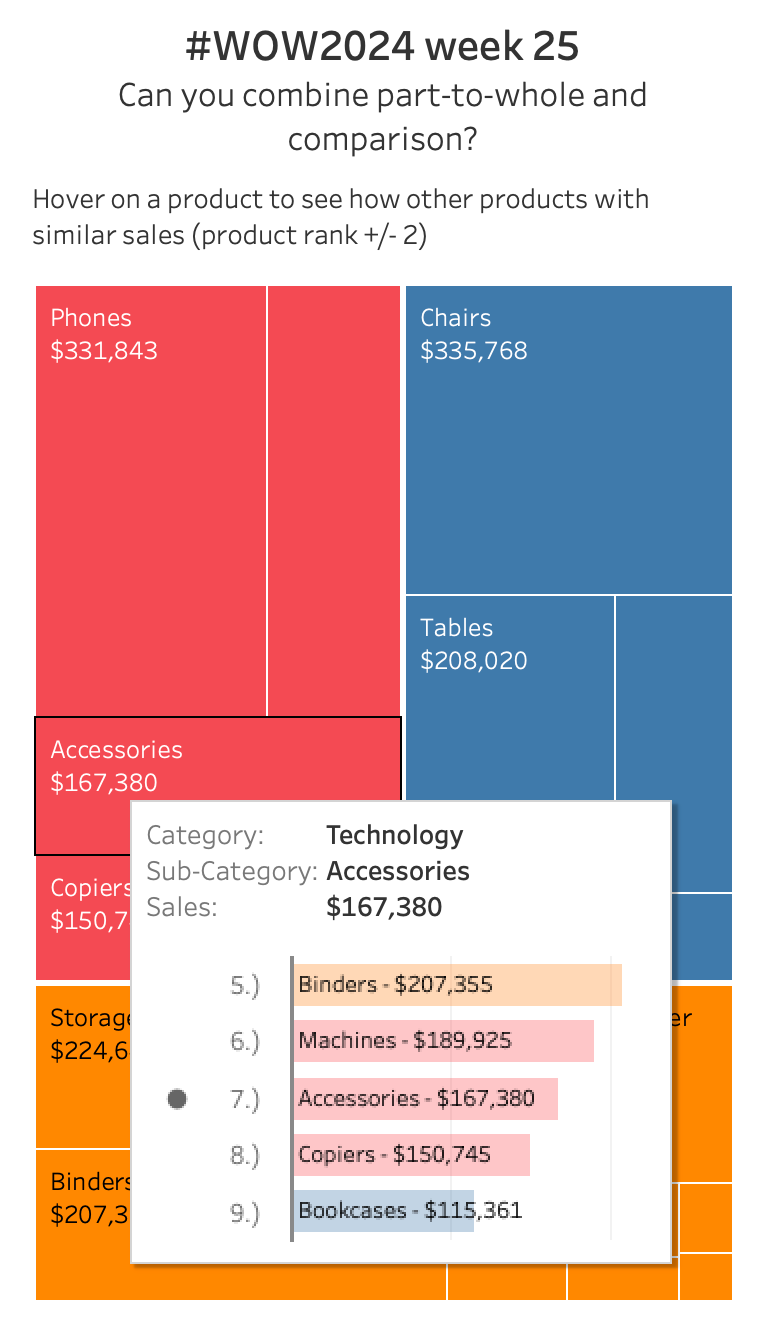
That’s the essence of this week’s challenge. I want you show the part-to-whole relationship but also where does it rank in overall terms and which other dimension members are near the one you’ve selected?
Requirements
- Dashboard size: 375 x 677
- Make a treemap of subcategory by sales; colored by category
- create a tooltip that shows the selected subcategory overal sales rank as well as the other subcategories +/- 2 ranks
- Match formatting
Dataset
This week uses superstore. You can get a copy of it here
Attribute
When you publish your solution on Tableau Public make sure to take the time and include a link to the original inspiration. Also include the hashtag #WOW2024 in your description to make it searchable!

Share
After you finish your workout, share on Twitter and/or LinkedIn using the hashtag #WOW2024 #Tableau and tag @WorkoutWednsday
