Introduction
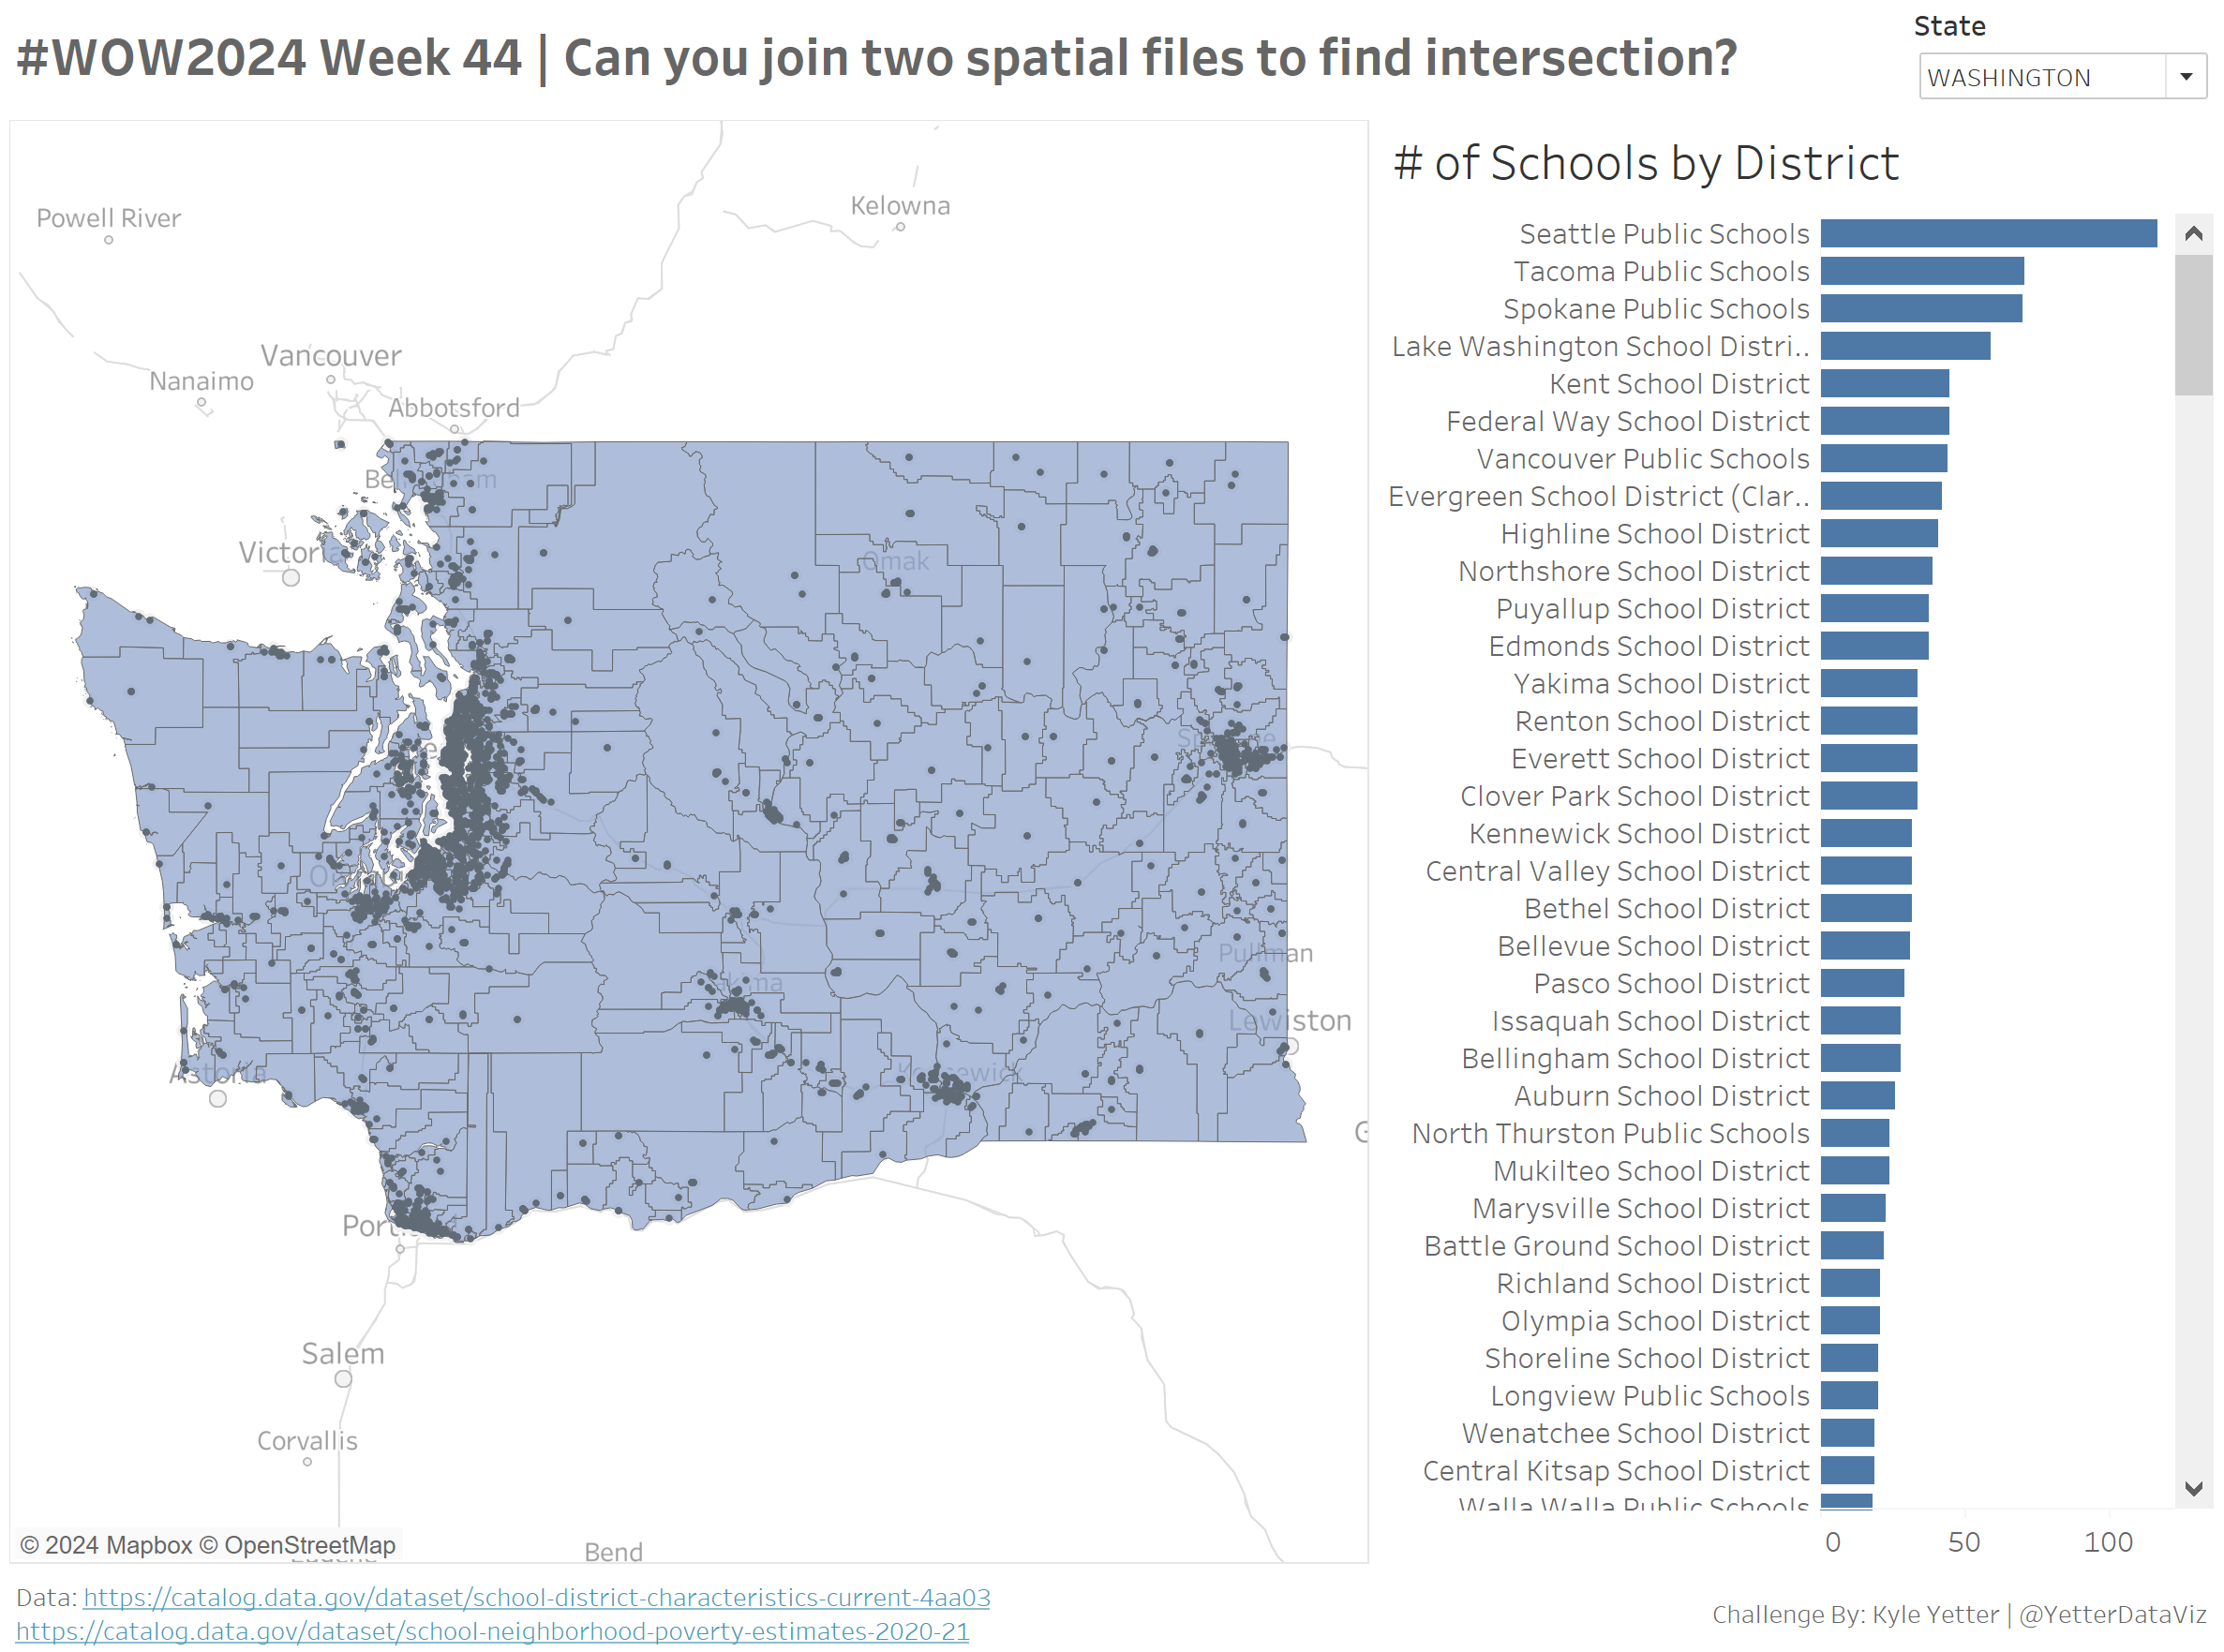
This week we’re working with some spatial data. I have a project at work where we’re finding the number of records (points) that are within a geospatial area (polygon), so we’ll try that this week. We’ll use public school district boundaries (polygons) and school locations (points) to find the number of schools in each school district.
Requirements
- Dashboard size: 1200 x 900
- You’ll need to do a spatial join of the two data sources
- Create a map with school district boundaries and school locations.
- I turned off all the map background layers except cities and roads. I didn’t want all the background, but wanted some visual cues of where the district boundaries are.
- Create a filter for the State (school_district.Statename) to just look at one at a time
- Create a bar graph showing number of schools (school_neighborhood.objectid) by school district (school_district.lea_name)
- Clicking on a bar should filter the map to that district
- Match tooltips
Dataset
This challenge uses two public datasets from data.gov. I downloaded the .zip Shapefiles from the School District Characteristics and School Neighborhood Poverty Estimates. (We’re not looking into the poverty status of school neighborhoods this time, just using this set for school location points.)
Attribute
When you publish your solution on Tableau Public make sure to take the time and include a link to the original inspiration. Also include the hashtag #WOW2024 in your description to make it searchable!

Share
After you finish your workout, share on Twitter and/or LinkedIn using the hashtag #WOW2024 #Tableau and tag @WorkoutWednsday
