Introduction
Welcome to Week 46!
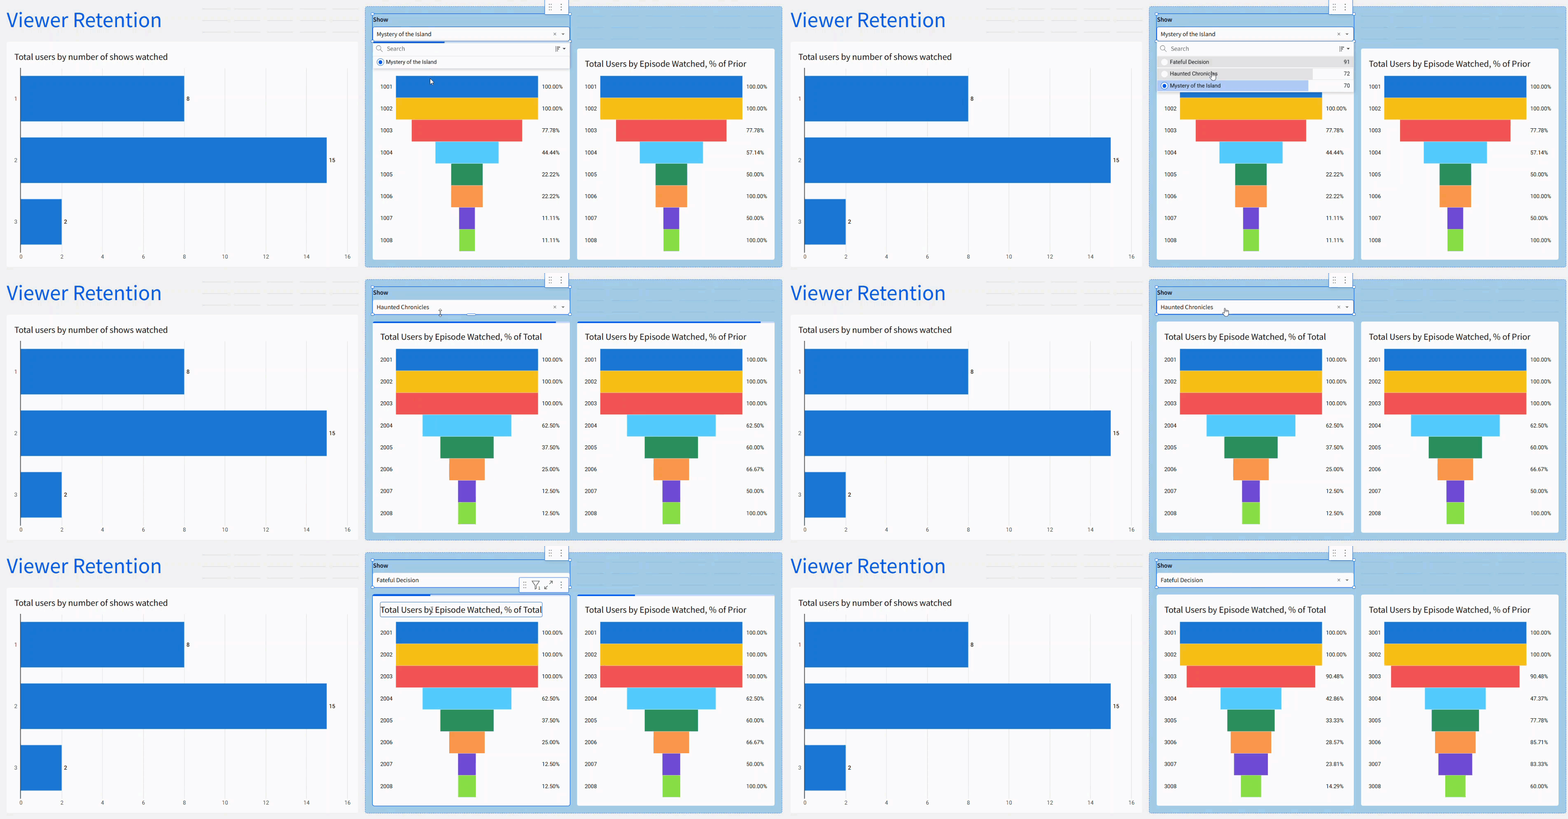
This week we pretend to be a streaming service, trying to see which of our 3 new shows are doing well with the viewer base. Funnel charts will be our main focus here, but feel free to play around with the sample data to find other key insights!
The formatting styles and colors in this challenge are all up to you. Try to make the report easy to read, with the important data popping!
Have fun!
Need access to Sigma?
Note: You will only have view access to WOW Workbooks, Folders, and Workspaces, not edit access. Please create your WOW Workbooks under “My Documents.” We suggest creating a folder to organize all your workbooks.

Requirements
- Create a new input table and paste in the data found in this google sheet. Alternatively, download the data from the sheet into a csv file, and upload as a new table. https://docs.google.com/spreadsheets/d/1XHx_nCAu_mcFQJ0ZmmY8zaUkQ57ATp5JjpBxFt3DJM0/edit?usp=sharing
- Create a child element with the userid in the grouping and the count of name_of_show in the calculation.
- Create a child viz of your table – a horizontal bar chart, with the count of shows in the Y axis, and the count of distinct users in the x axis. This chart shows how many shows out of the 3 users are watching.
- Create a child viz of the source data.
- Change the viz type to Funnel.
- Put the item watched id (id_of_item_watched) in the Stage and the count of users as the value.
- Go to the formatting settings to add the stage name on the left side.
- Change the percentage style to % of total. This will show the percent of total users that completed that stage (or watched that episode).
- Name the Funnel chart appropriately, so we know it is the % of total.
- Duplicate the funnel chart
- Change the percentage style to % of Prior. This will show how many users watched the episode as a percent of users who watched the previous episode.
- Rename the new Funnel chart appropriately.
- Create a list type page control.
- The source of the control should be the show name from the source data.
- Target both funnel charts with the control.
- Remove the null option, and change the control to single selection.
- Place the control and both funnel charts in a container.
- Move the source tables to a hidden tab, so only the visualizations and page control show on the main tab.
- Extra Credit – find a way to display the show name and episode number instead of the item ID in the stage name, while still sorting appropriately.
- Add any additional formatting you’d like, and don’t forget to share your solution!
Dataset
https://docs.google.com/spreadsheets/d/1XHx_nCAu_mcFQJ0ZmmY8zaUkQ57ATp5JjpBxFt3DJM0/edit?usp=sharing
Share
After you finish your workout, share on LinkedIn, Sigma’s Community page, (or Twitter) using the hashtags #WOW2024 and #SigmaComputing, and tag Ashley Bennett, Eric Heidbreder, Katrina Menne, and Michal Shaffer!
Create an interactive, sharable version of your solution here.
Also, make sure to fill out the Submission Tracker so that we can count you as a participant this week to track our participation throughout the year.