Introduction
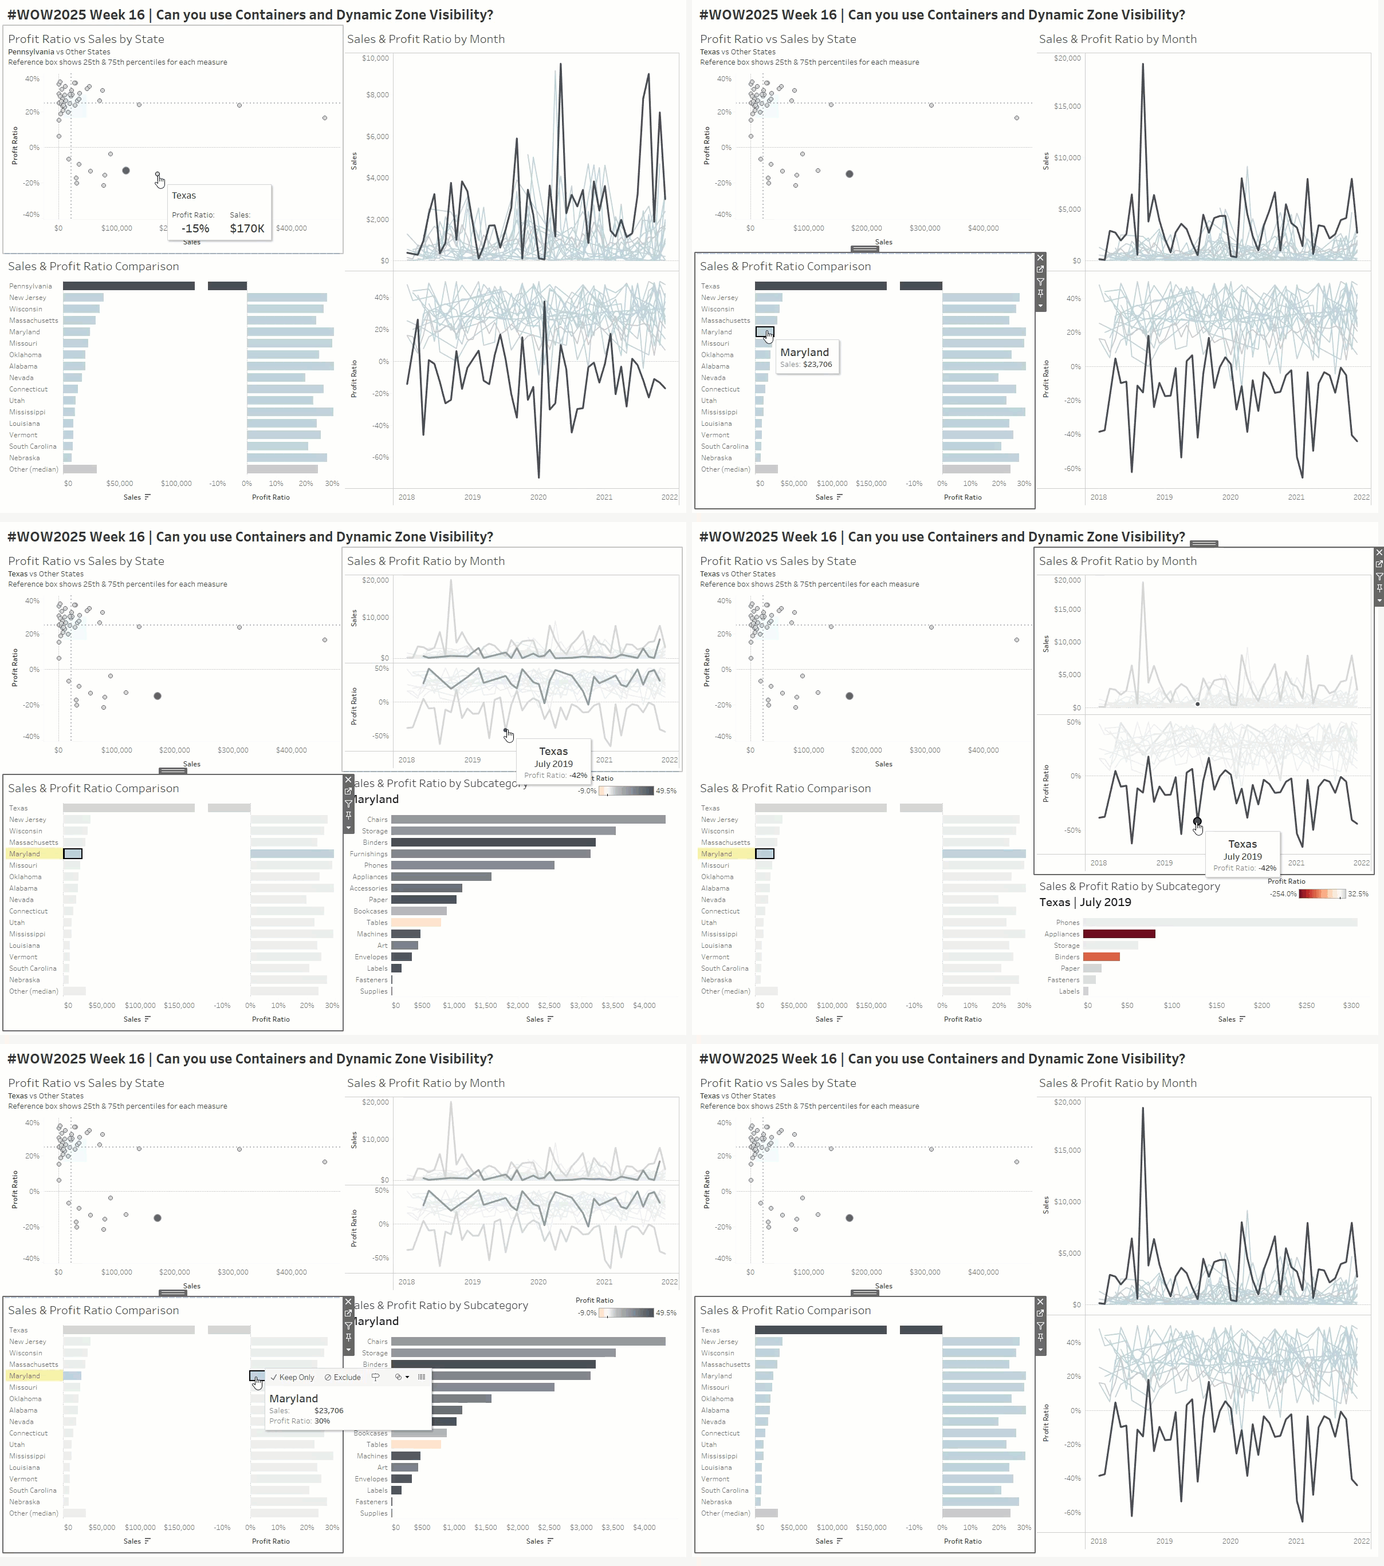
This week we’re live at Tableau Conference! Our focus is going to be on a dashboard layout using containers and actions. I’ve built a starter workbook with most of the charts you’ll need, so you’ll just be building one chart and putting them all together on the dashboard with the actions needed.
Requirements
- Size 1200×900
- Create the Dashboard layout as shown using containers (NO FLOATING)
- Create a bar chart – Sales/Profit Ratio by Subcategory
- Show chart (and title/legend) when selecting ‘State’ from ‘Sales & PR Comparison’ or Month from ‘Sales & PR by Month’
- Build a dynamic title, showing state, month selected (if applicable)
- Show color legend
- When you click on the scatterplot, set ‘Scatterplot State’ param
- Deselect so highlighting doesn’t remain (nothing grayed out)
- When you click on the comparison bar, set State Name Set (single click only)
- Highlight that state in the line chart
Dataset
Download the starter workbook here
Attribute
When you publish your solution on Tableau Public make sure to take the time and include a link to the original inspiration. Also include the hashtag #WOW2025 in your description to make it searchable!

Share
After you finish your workout, share on Twitter and/or LinkedIn using the hashtag #WOW2025 #Tableau and tag @WorkoutWednsday
