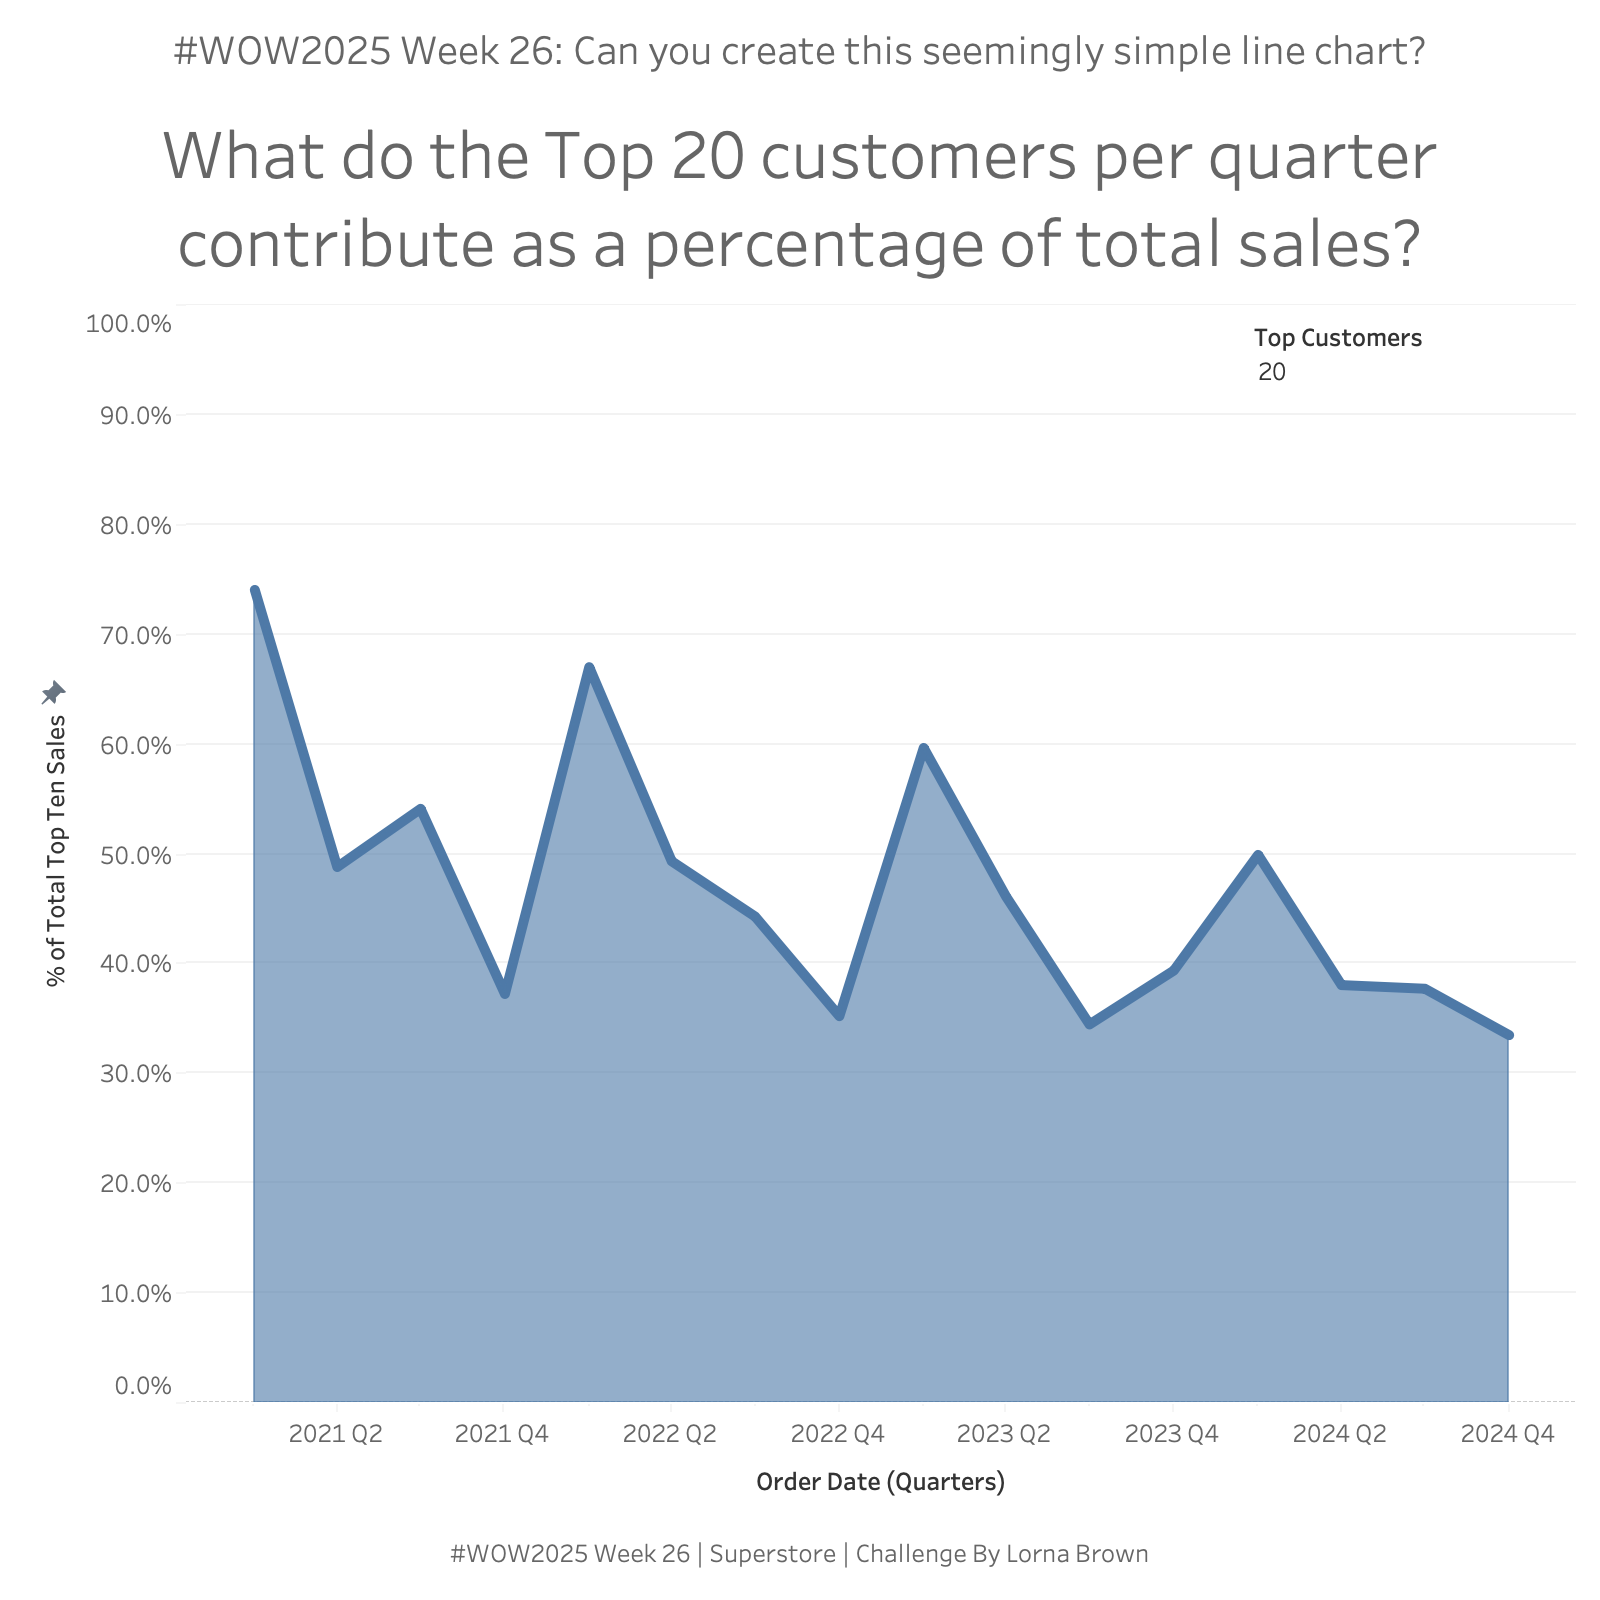
This may seem like a seeming normal line and area chart but I said “Why Tableau” numerous times when trying to create it. You want to be able to see the Top X customers per Quarter and what their percentage of total sales is.
Available from here. Or if you have superstore ready to go.
Attribute
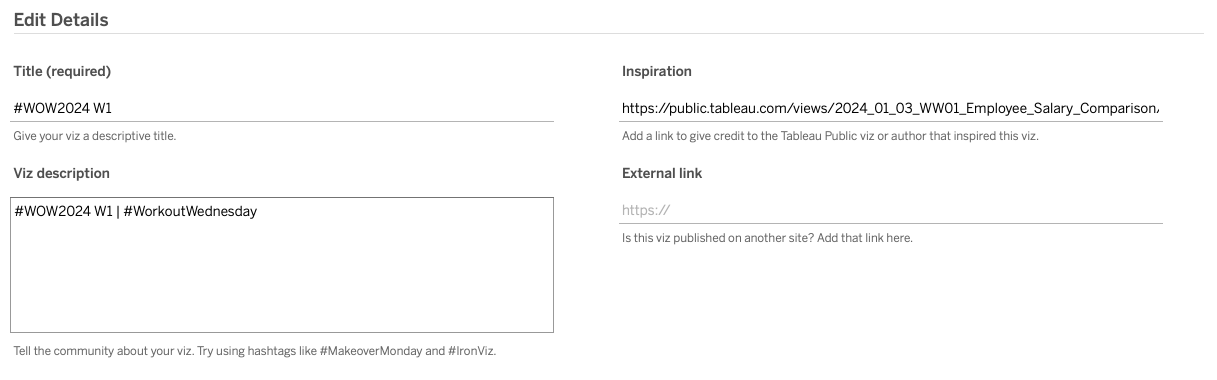
When you publish your solution on Tableau Public make sure to take the time and include a link to the original inspiration. Also include the hashtag #WOW2025 in your description to make it searchable!