Introduction
One of the most common questions I get is how to build a sales funnel. I always answer: just build a bar chart! That’s what we are going to do today. To build that sales pipeline we are going to have data where we know the latest stage, but it doesnt track the previous stages. We only know they always flow through each stage: Prospect, Lead, Qualified, Opportunity, Negotiations, and Closed. You challenge is to calculate the total value that has funneled through each stage of the sales pipeline.
To do this you’ll need to use a table calculation where the calculation is Table Up. Of course, this option doesn’t exist, you only have Table Down and Table Across. So how will you solve it?
Requirements
- Dashboard Size: 700 by 400 px
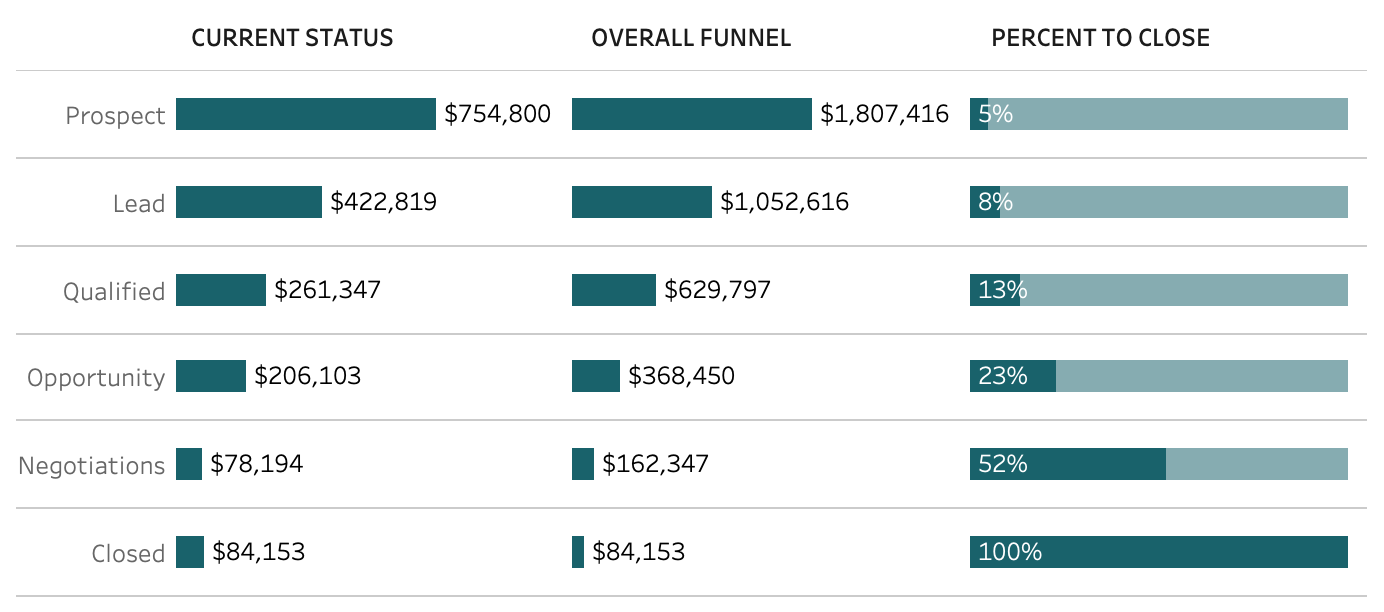
- Show three columns of bar charts:
- the total value of the sales opportunity currently at each stage
- total dollars that have passed through each stage of the funnel: (Ex: Closed sales have gone through each stage and should be included at each level, Negotiations should be added to every stage except closed)
- The total percentage of sales that have closed that have passed through that stage level.
- Color the background of the percent of sales to close a lighter green.
Dataset
This week’s challenge uses a custom data set for sales. You can get it here.
Attribute
When you publish your solution on Tableau Public make sure to take the time and include a link to the original inspiration. Also include the hashtag #WOW2020 in your description to make it searchable!

Share
After you finish your workout, share on Twitter using the hashtag #WOW2020 and tag @AnnUJackson, @LukeStanke, @_Lorna_Brown and @LosaniMeera

#WOW2020 and tag @AnnUJackson, @LukeStanke, @_Lorna_Brown and @LosaniMeera
My soulution: https://public.tableau.com/profile/gauri.t6445#!/vizhome/2020Week14Howdoesthesalespipelinelook_15858642008140/2020Week14Howdoesthesalespipelinelook?publish=yes
This is cool and very useful! Thanks for the clear explanation!
Hello all,
where can I get the data for this chalenge?