Introduction
When Lorna asked me to be a Community contributor for Workout Wednesday, honestly, I was hesitant since I don’t participate every week. I typically only take on the challenges that I think are most beneficial to me as a teacher. I want to share work that I know the Data Schoolers are likely to use on their placements. Lorna talked me into it (she’s my favorite after all) and I have something pretty straightforward to share with you this week.
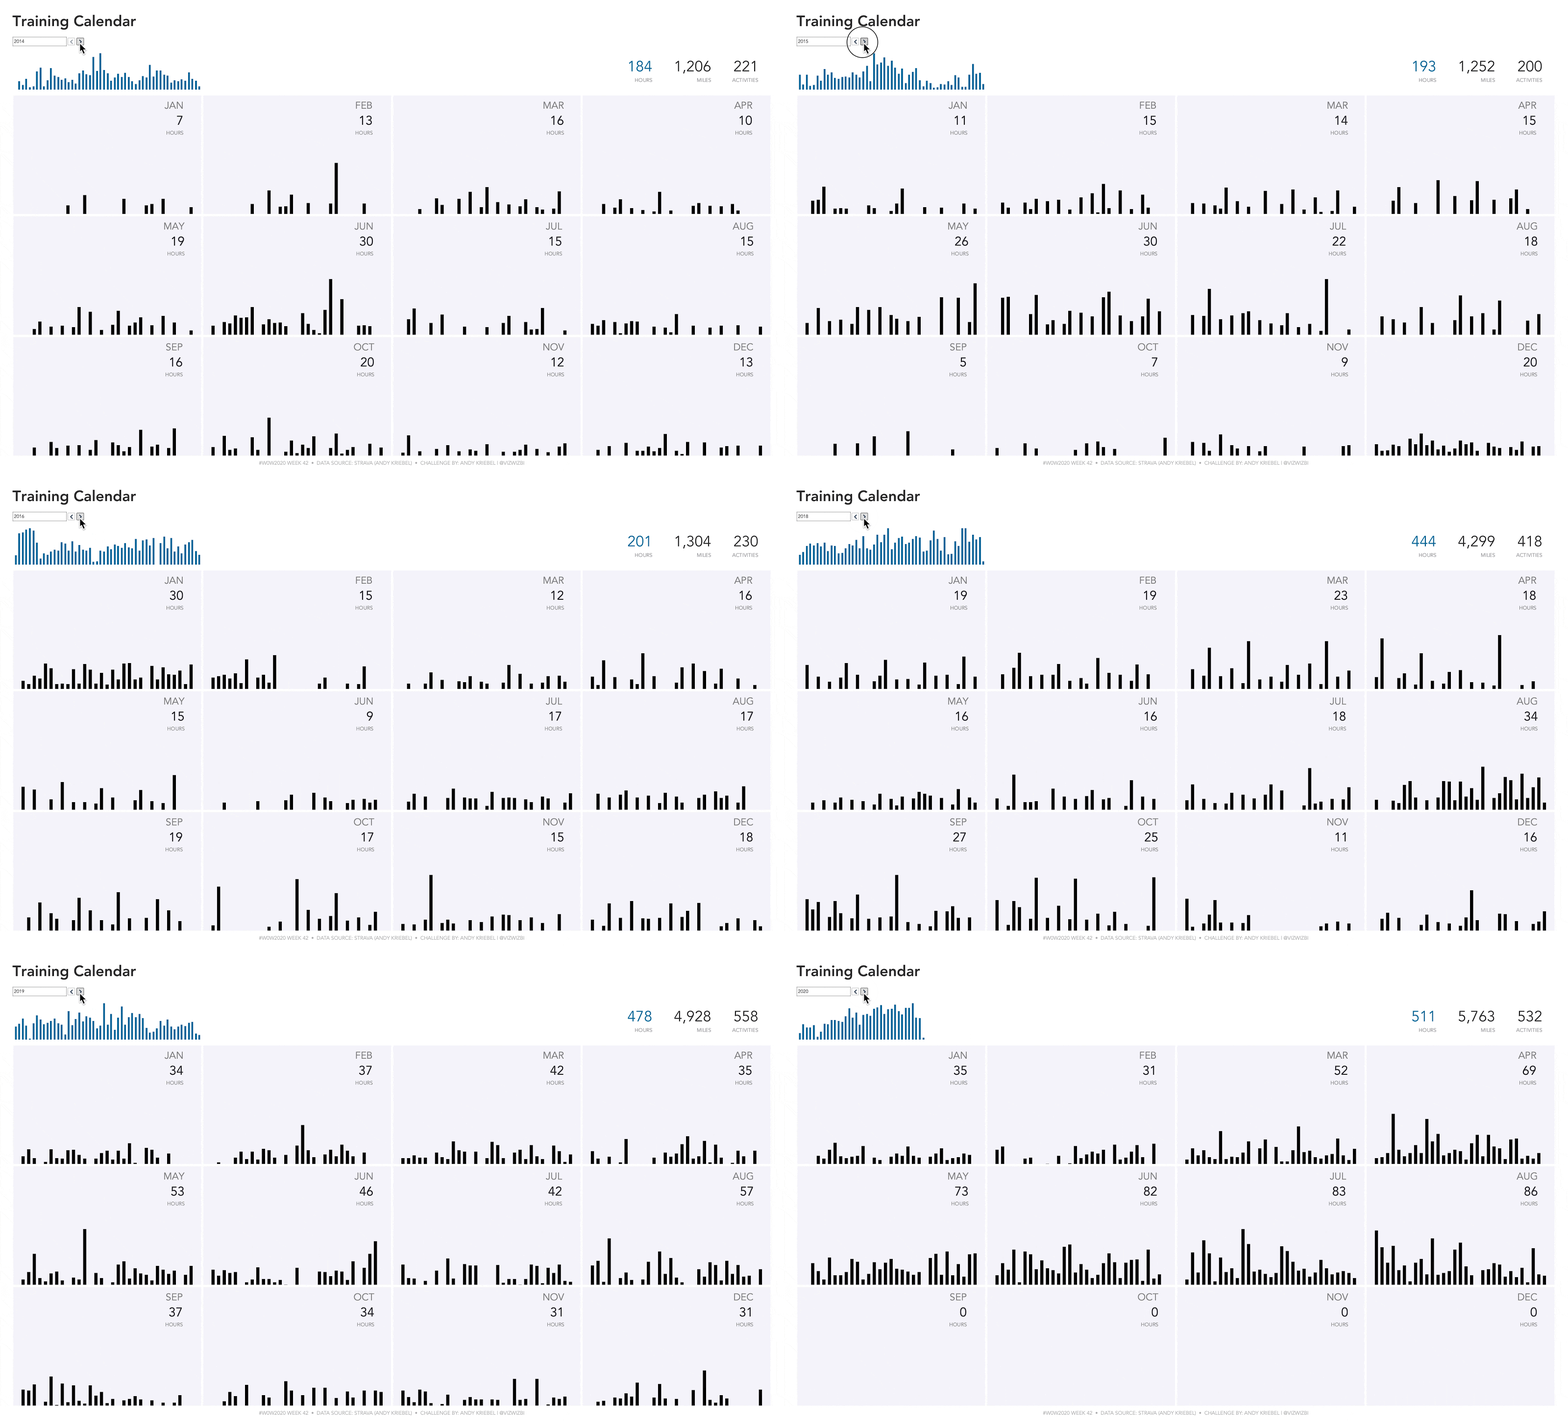
I’m a keen triathlete and track all of my activities on Strava. There are some great dashboards and visualizations that help you understand your performance. One of my favorite is the Training Calendar. It gives you an overview of an entire year at once. And that’s what you’ll build for this workout.
Requirements
- Dashboard size: 1680 x 1020
- Max 3 sheets
- Max 1 text box
- Joins are not permitted
- Data model is not permitted
- They MUST be separate data sources.
- No Level of Detail expressions
- Remove highlighting from anything you can click
- Match formatting and tooltips
- The blue hex code is #0070A0.
- The blue bars on the upper right are the weekly number of hours spent exercising.
- The black bars in the main chart are the daily hours spent exercising.
- Any days when I did not exercise should have zero hours displayed.
- Allow scrolling through the years
- No Annotations, No Text Boxes on the main chart and No Floating
Dataset
The two files you need can be downloaded here. REMEMBER: No joins or data modeling!
Attribute
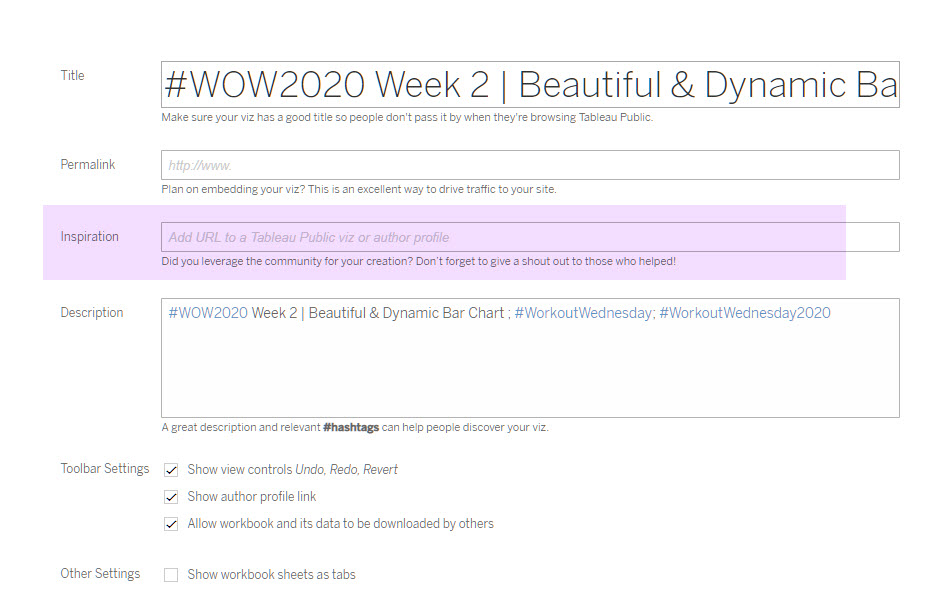
When you publish your solution on Tableau Public make sure to take the time and include a link to the original inspiration. Also include the hashtag #WOW2020 in your description to make it searchable!

Share
After you finish your workout, share on Twitter using the hashtag #WOW2020 and tag @VizWizBI, @AnnUJackson, @LukeStanke, @_Lorna_Brown and @HipsterVizNinja


