Introduction
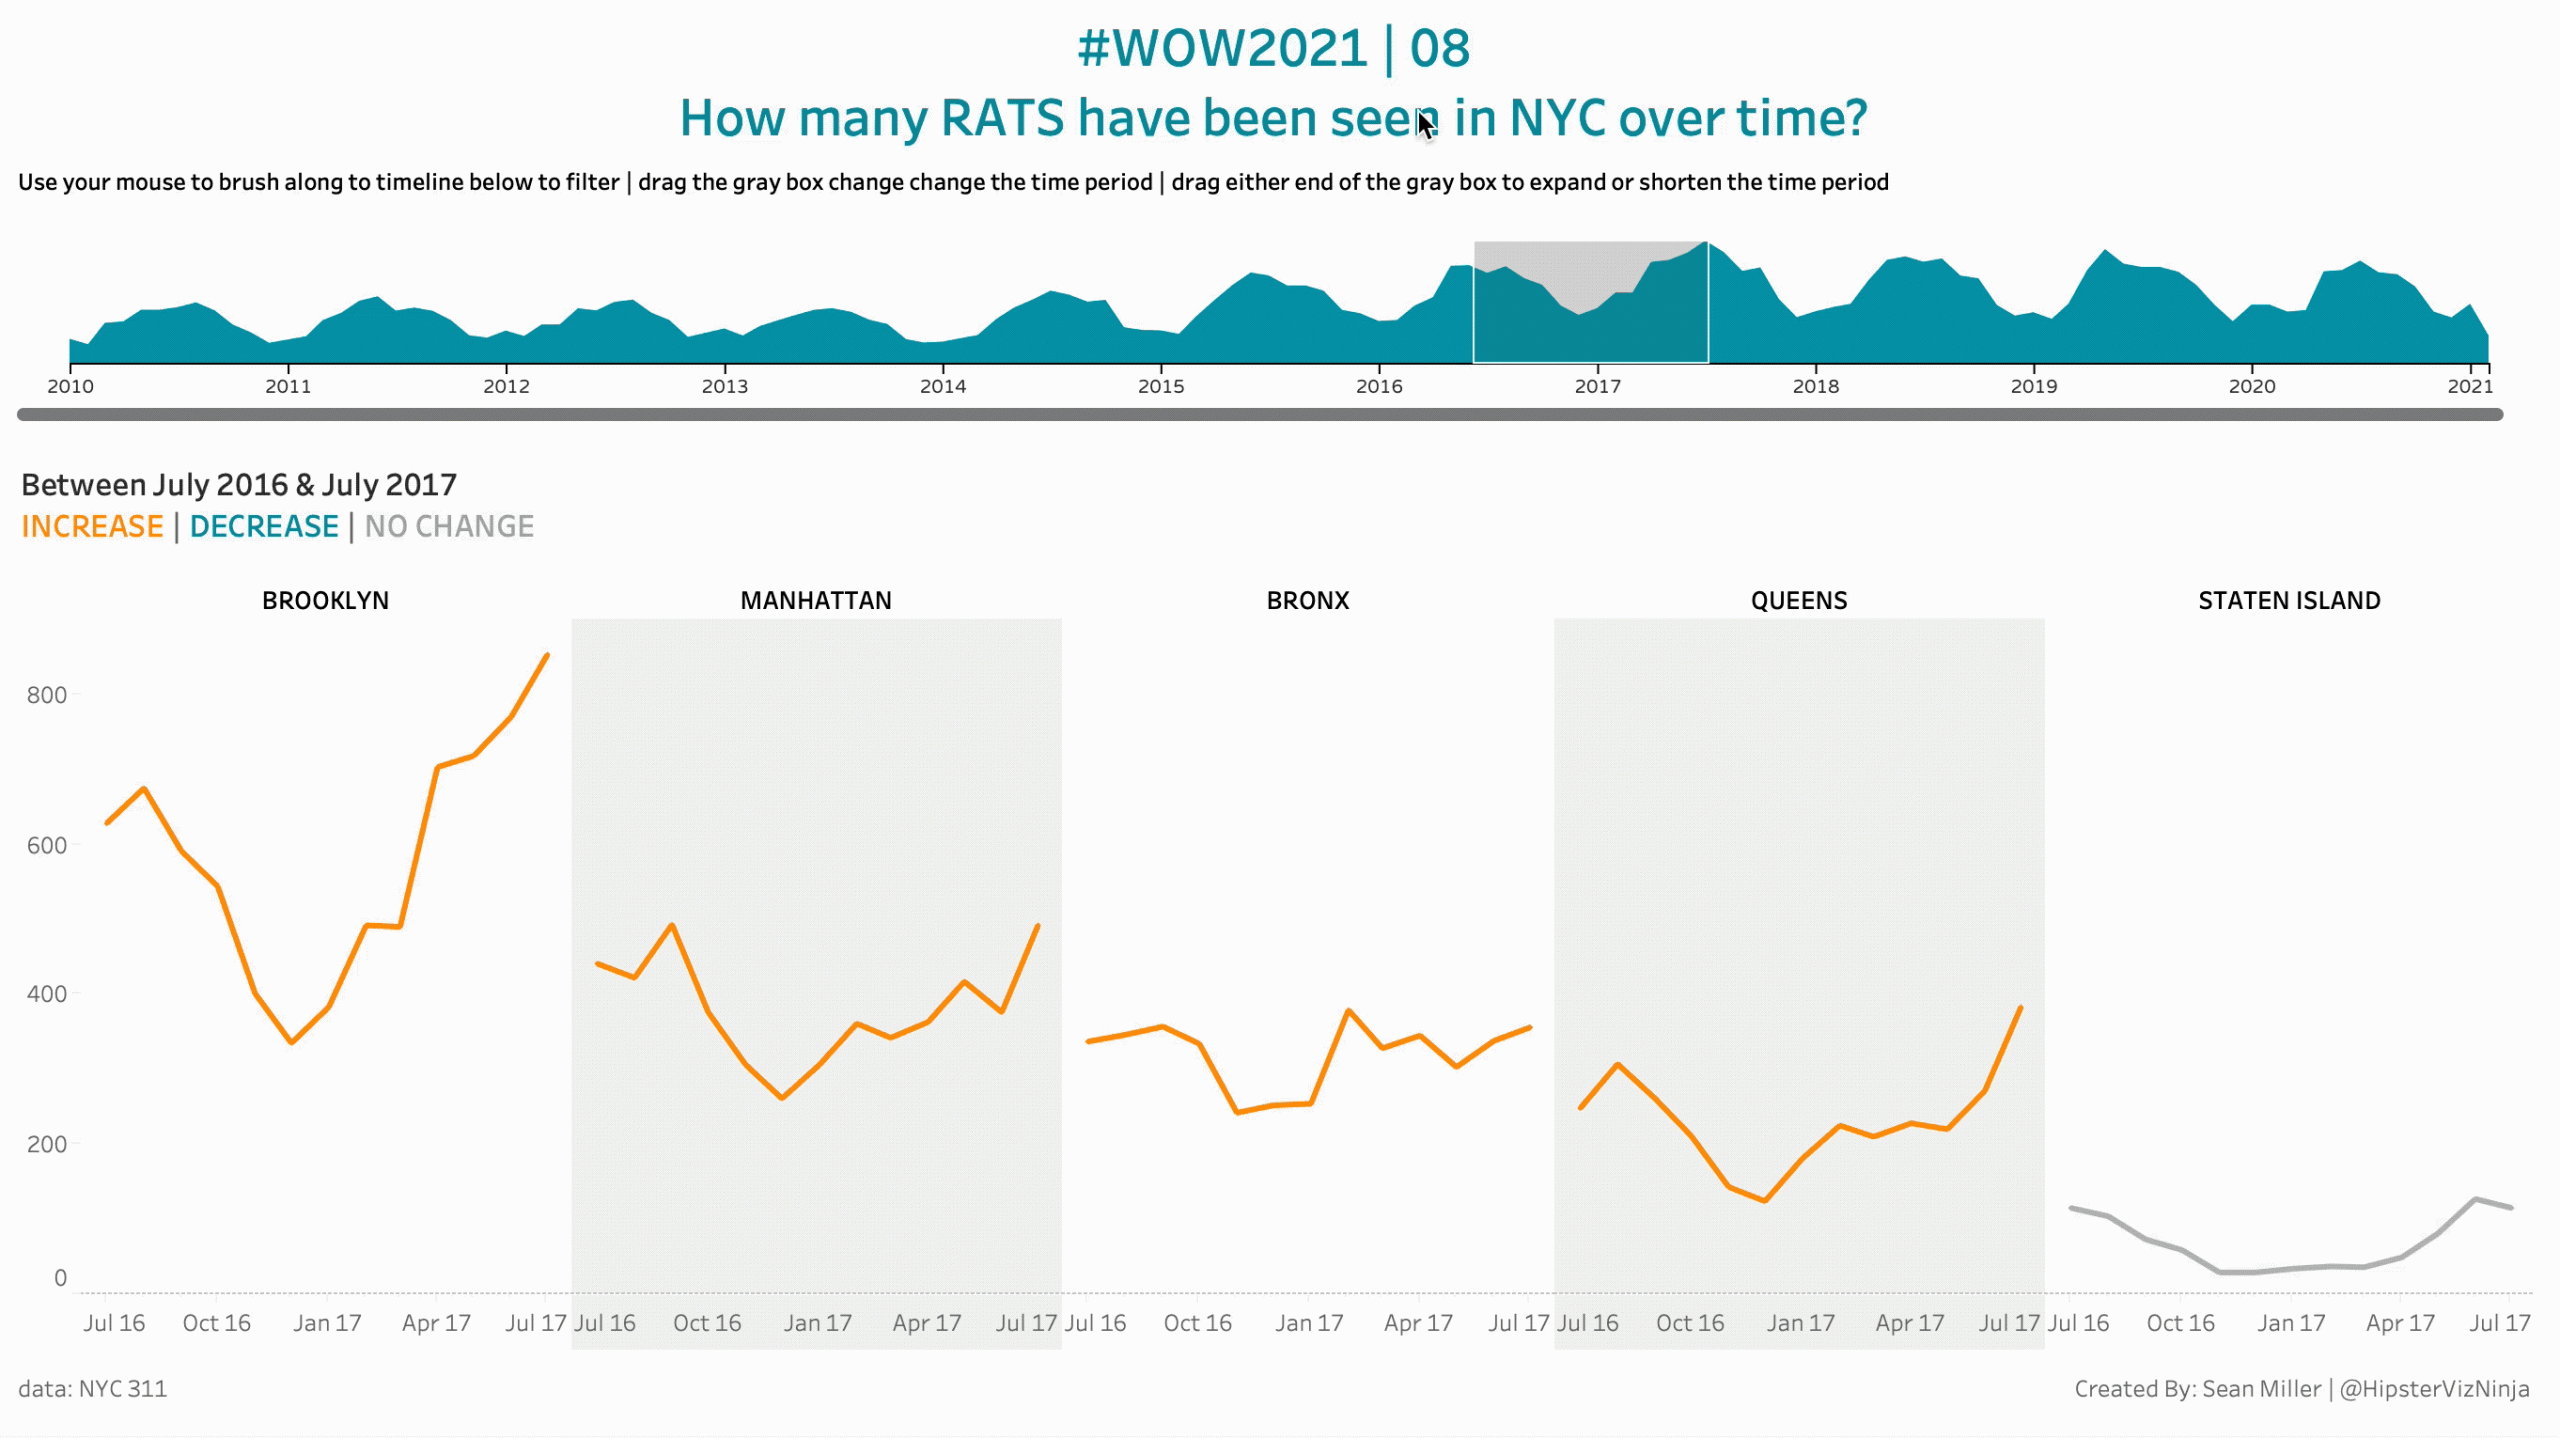
It’s pretty exciting that extensions are live on Tableau Public! Last week, Lorna explored the image map filter extension, you should go check it out if you haven’t already. I’m going to keep the enthusiasm up with another extension…The brush filter. Brush filtering is a very common date filtering capability found in my custom web apps. Well, now thanks to the brilliant folks at Starschema, we can implement brush filtering in Tableau Public. So let’s get to it!
Requirements
- Dashboard Size: Generic Desktop
- # of Sheets – up to you
- Create a monthly trend line by NYC borough
- Add a brush filter extension from Starschema
- Colors
- blue: #31A1B3
- orange: #F28E2B
- gray: #B4B7B7
- Color the lines based on the difference between the two ends of the filter window (see chart title)
- Create a dynamic title that indicates the date range.
- Match all other formattings
- Have fun!
Dataset
This week uses the Rat Sightings dataset from NYC 311. In the top right of the page, click export and then your file type of choice.
Attribute
When you publish your solution on Tableau Public make sure to take the time and include a link to the original inspiration. Also include the hashtag #WOW2021 in your description to make it searchable!

Share
After you finish your workout, share on Twitter using the hashtag #WOW2021 and tag @AnnUJackson, @ItsCandraM, @LukeStanke, @_Lorna_Brown and @HipsterVizNinja
