Introduction
This week’s challenge is pulled directly from a work challenge I encountered recently. The ask was to build a filtering system that would allow the user to initially filter data and then add a secondary requirement of inclusion.
Using the Superstore data set, the functionality we wanted to achieve was:
- Allow user to filter to orders with specific products specified
- Then allow the user to require that an order must also include an additional product they specify.
This type of analysis is useful to find out common product pairings, or to do market basket analysis, or to find out what else is “commonly purchased” with certain products.
It’s especially useful when you’re showing a visualization at a higher data grain than the underlying data set. In the case of Superstore we’re showing Order level detail, but mining data at the product (or line item) level.
Requirements
- Dashboard Size: 1200px by 900 px
- # of Sheets – up to you
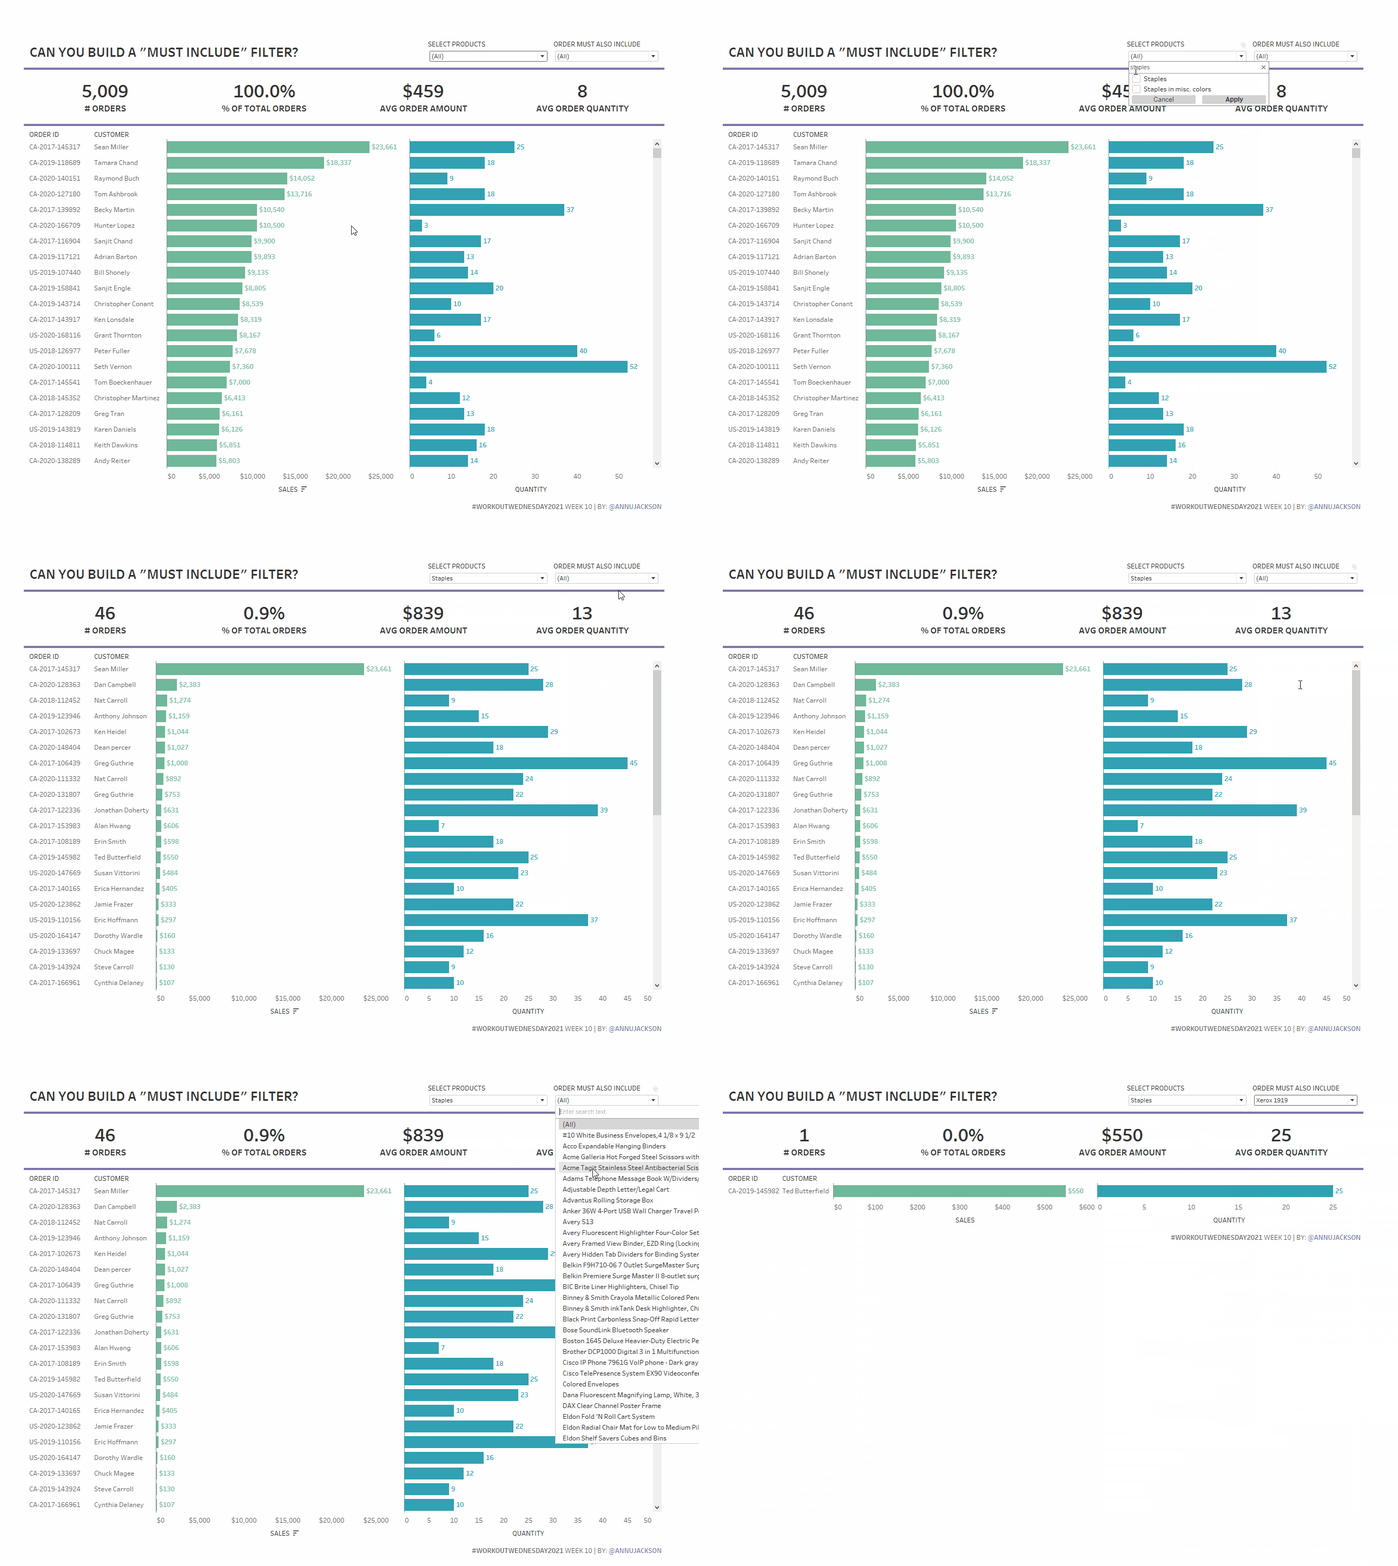
- Create functionality that allows the user to filter to products and then require another product to be a part of the order
- Create a bar chart that shows Order ID, Customer, Sales, and Quantity total
- Should show detail of what was included in the order within tooltip
- Create a set of BANs that shows
- Total orders that meet the filter requirements
- % of total orders that meet the filter requirements
- Average order amount of those that meet the filter requirements
- Average order quantity of those that meet the filter requirements
- Match formatting and tooltips
- Font = Tableau Regular
- Colors = Nuriel Stone
PS: No data modeling or restructuring required. You do need version 2020.2 or greater!
Dataset
This week uses the superstore dataset for Tableau 2020.4. You can get it here at data.world
Attribute
When you publish your solution on Tableau Public make sure to take the time and include a link to the original inspiration. Also include the hashtag #WOW2021 in your description to make it searchable!

Share
After you finish your workout, share on Twitter using the hashtag #WOW2021 and tag @AnnUJackson, @ItsCandraM, @LukeStanke, @_Lorna_Brown and @HipsterVizNinja

Hi all!!
Thanks for the challenge! I’m new to Tableau and I have a question.
How we can do this painel with #orders, % total orders… ?
Oi pessoal!
Obrigado pelo desafio! Eu sou novo no Tableau e estou com algumas dúvidas.
Como eu posso reproduzir esse primeiro painel com o número de ordens e porcentagem…?
Raphel – this is your job to figure this out 🙂
I use tableau public 2021.1, but i can’t find the option “All values in context” in SET.
is the function only avaliable in desktop version?
Hi,
Just starting out with Tableau. This was a great beginner challenge!
Here is my viz: https://public.tableau.com/views/WOW2021Week10_16225935551420/WorkoutWednesday2021Week10MustIncludeFilter?:language=en-US&:display_count=n&:origin=viz_share_link
Thanks!