Introduction
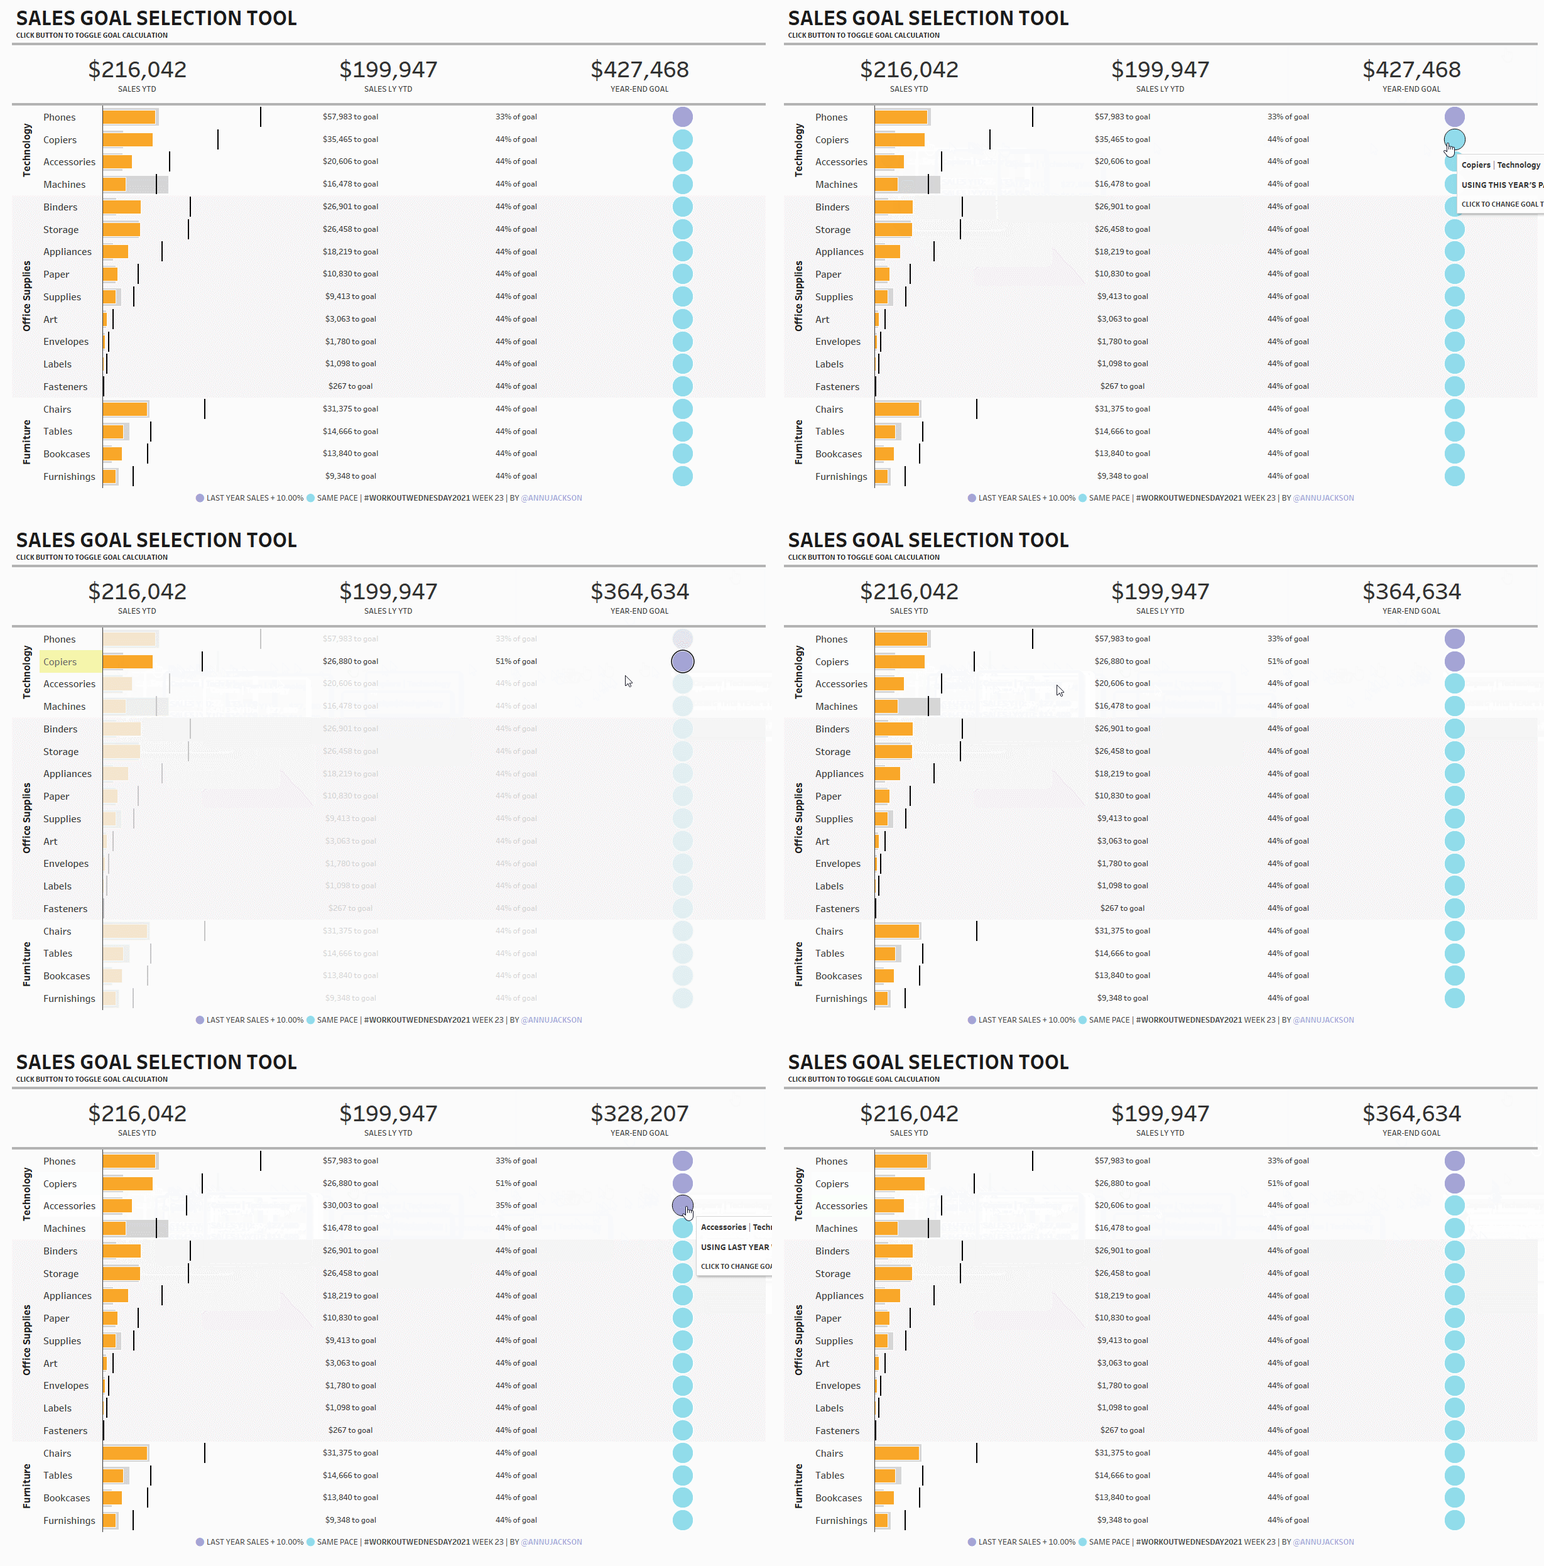
This week’s challenge is inspired by a recent situation I encountered. The dashboard users had two different ways to calculate a goal and wanted the option to change how the calculation works for each category. Not only that, they wanted to be able to take the mixed calculations and sum them up to get an overall goal for the year.
So that’s your challenge for the week! Build out functionality to support 2 different goals, one that can be toggled interactively and one that will aggregate up.
Requirements
- Dashboard Size: 1200px by 800 px
- # of Sheets – 2
- Create BANs with Sales YTD, Sales LY YTD, and a Year-End Goal
- For the sake of the challenge, I’ve got “Today” statically set to 6/9/2021 with a parameter
- Create a bar chart with a goal line with the same calculations as above
- Create distance to goal and % of goal calculations
- Create functionality that lets the user click on a circle to change the goal calculation type and then a way to toggle back
Goal calculation methodology. For “same pace” find the average sales per day for 2021, use that value to construct what a full year would be. For “last year + X%” use a parameter that has a percentage increase. I selected 10% and then hid the parameter, but you can expose it if you’d prefer!
If you’re up for the challenge, make sure your average sales calculations can withstand leap years.
Dataset
This week uses the superstore dataset for Tableau 2021.1, which has data through 12/31/2021. You can get it here at data.world
Attribute
When you publish your solution on Tableau Public make sure to take the time and include a link to the original inspiration. Also include the hashtag #WOW2021 in your description to make it searchable!

Share
After you finish your workout, share on Twitter using the hashtag #WOW2021 and tag @AnnUJackson, @ItsCandraM, @LukeStanke, @_Lorna_Brown and @HipsterVizNinja
