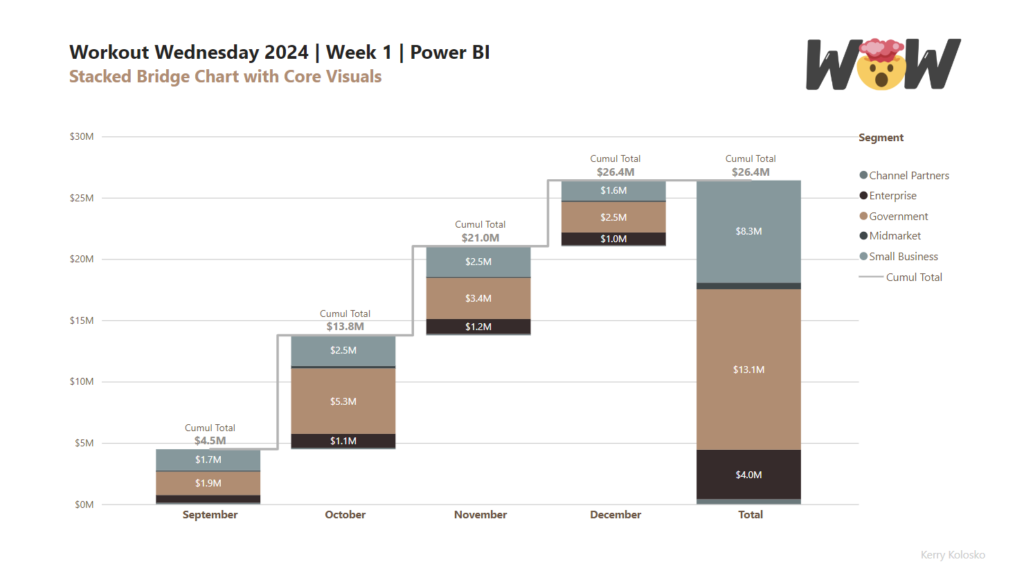
2024 Week 1 | Power BI: Stacked Bridge with Core Visual
Introduction This week’s challenge builds on last weeks challenge to utilise updated column fill and data labelling features from the Power BI December 2023 release. The challenge will be to create a stacked bridge chart using the core column and line combo chart. Building the bridge will require calculated tables. Intermediate users can use the […]
2024 Week 1 | Power BI: Stacked Bridge with Core Visual Read More »