Luke Stanke

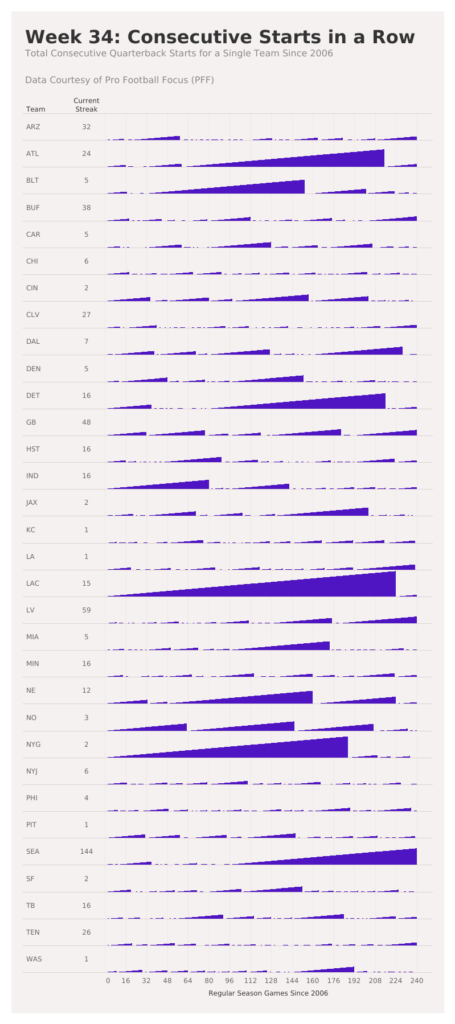
2021 Week 34: How Many Consecutive Starts?

Introduction Today I’m excited to share a challenge in collaboration with Dr. Eric Eager at PFF. PFF analyzes data about professional football (in this case the American version). In this game, there are many players, but the most critical player supports a role called the Quarterback. In this challenge you’ll count the number of consecutive …

2021 Week 34: How Many Consecutive Starts? Read More

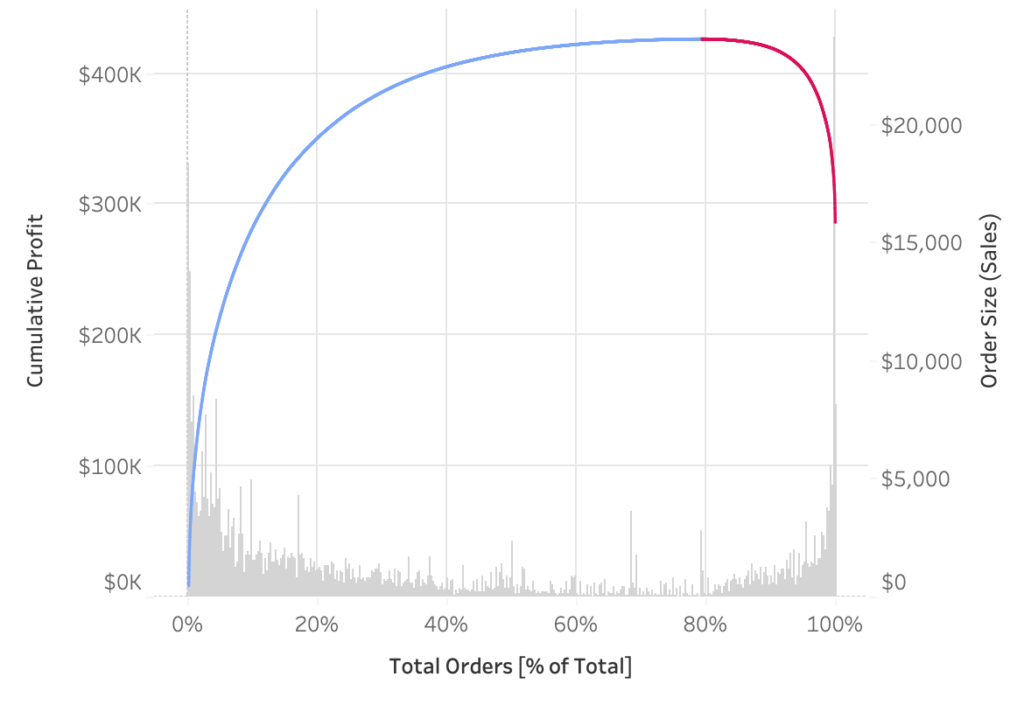
2021 Week 26 – Tableau: Profitability with Dual Axis Charts

Introduction This week we are going to do two things:  look at alternative for the most common scatterplot I see in Tableau. use a very uncommon unsynchronized dual axis chart. First, the chart I always run into is this scatterplot of total sales and total profit by order. While we can see which orders were …

2021 Week 26 – Tableau: Profitability with Dual Axis Charts Read More

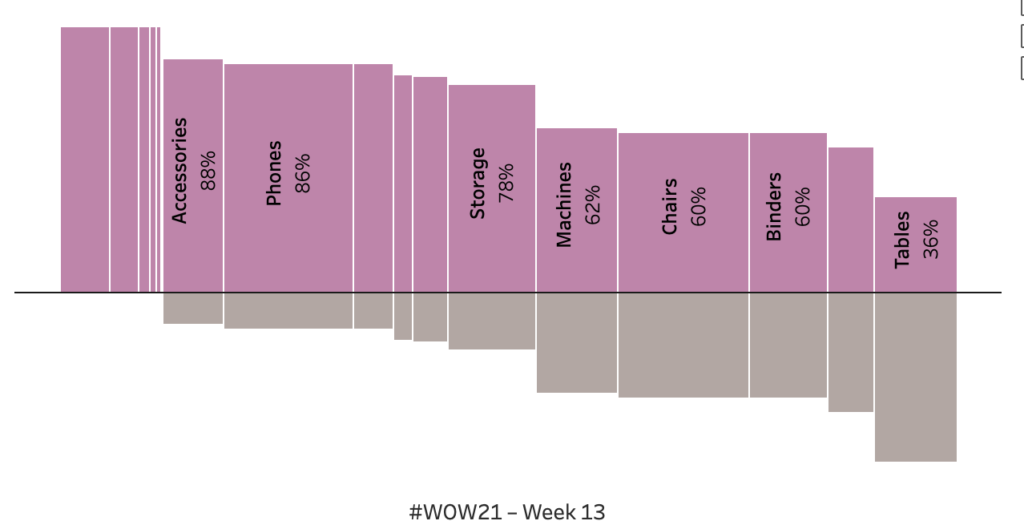
2021 Week 13 | Tableau: What percentage of sub-orders are profitable?

Introduction The goal is a modified mekko chart. My guess is you will need LODs to solve but it is 100% possible with table calculations. Click to open in Tableau Public Requirements Dashboard Size: 800px by 400 px Set the bar height to be percent profitable. The level of analysis should be at the sub-category …

2021 Week 13 | Tableau: What percentage of sub-orders are profitable? Read More

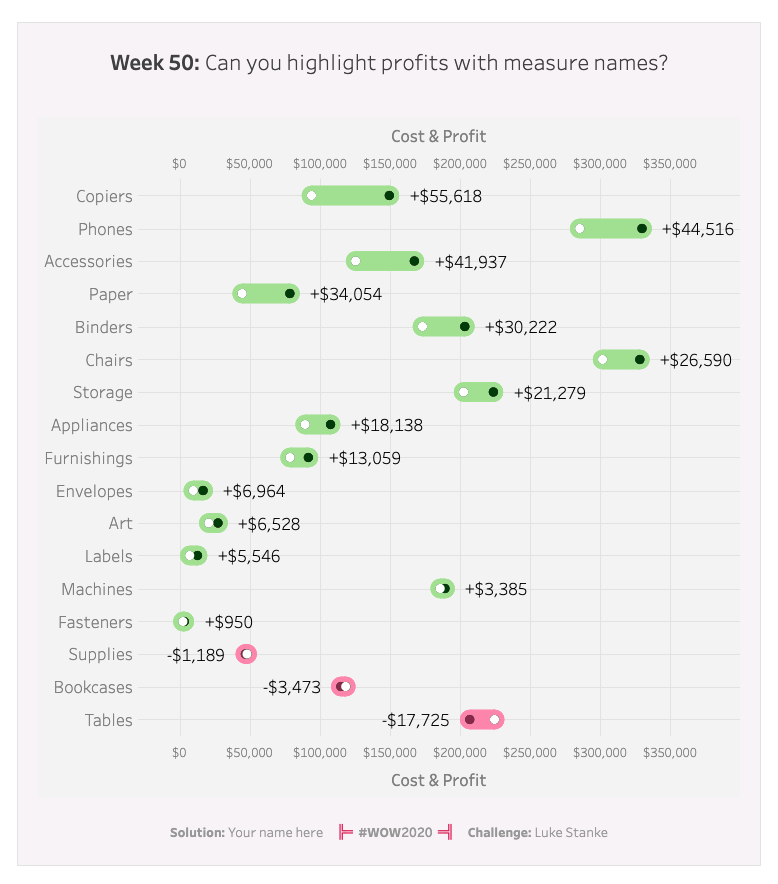
2020 Week 50: Can you highlight profits with measure names?

Introduction This week we are throwing it back to using measure names and measure values. There are two levels to this challenge:  Level 1 Showing the visualization as is, but without the circles around the white dots in each line Level 2 Adding a ring around the white dots on the viz. There is no …

2020 Week 50: Can you highlight profits with measure names? Read More

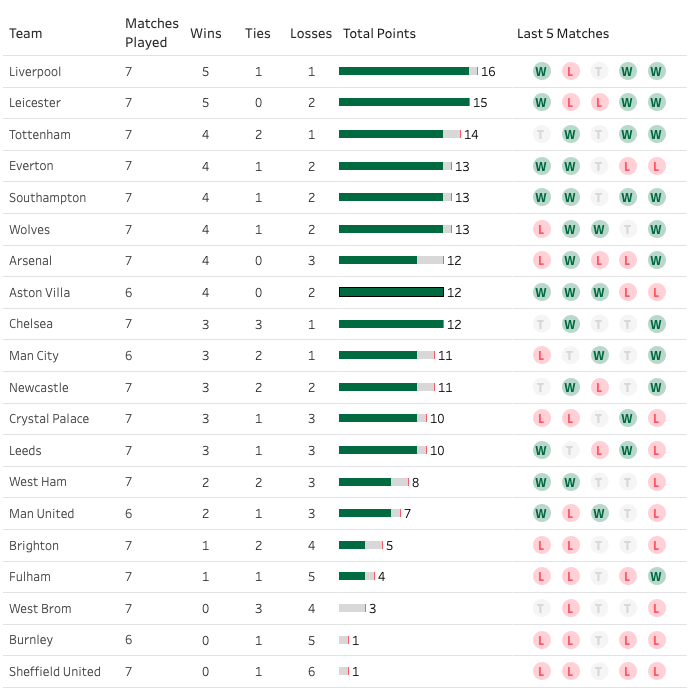
2020 Week 46: Can you build a Premier League table?

Introduction I was scrolling thru my Twitter timeline and noticed a comment by fellow Zen Master Simon Beaumont to #MakeoverMonday co-lead Charlie Hutcheson regarding tables, specifically the kind to track teams and the results of matches in the English Premier League (which are a group of the highest level teams that play football/soccer in England). …

2020 Week 46: Can you build a Premier League table? Read More

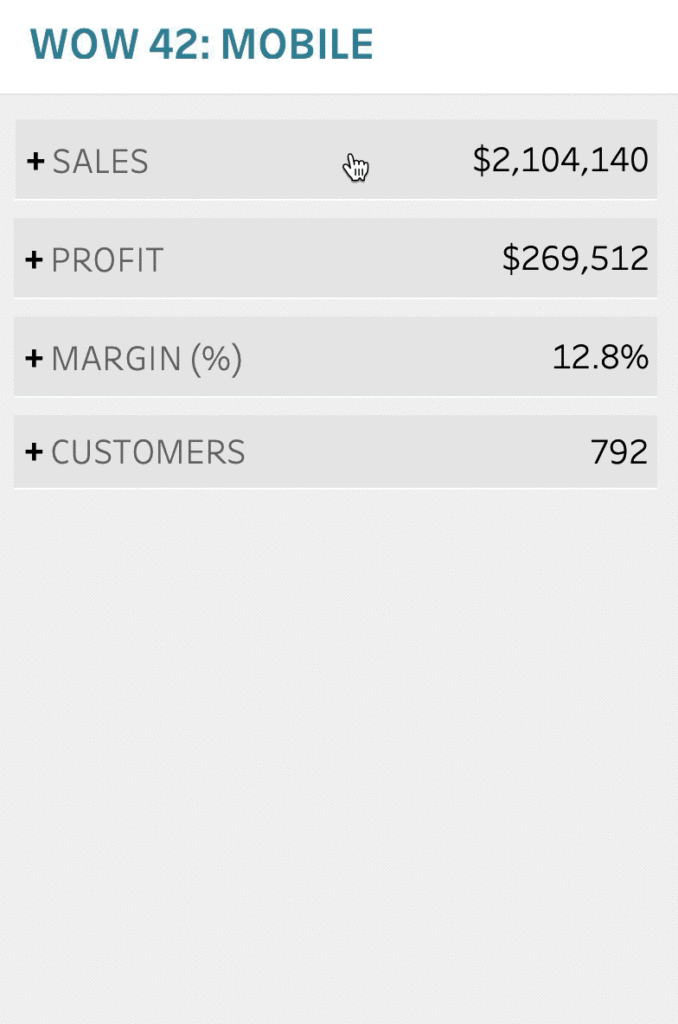
2020 Week 43: Mobile Dashboard Challenge

Introduction This week’s challenge is two parts: Mobile dashboard design and KPI design. First, designing for mobile is difficult, but mobile is all about simplicity and interactivity. In this case, the KPIs also act as buttons that will reveal bar charts showing performance by month. To me this design is    Click to open in Tableau …

2020 Week 43: Mobile Dashboard Challenge Read More

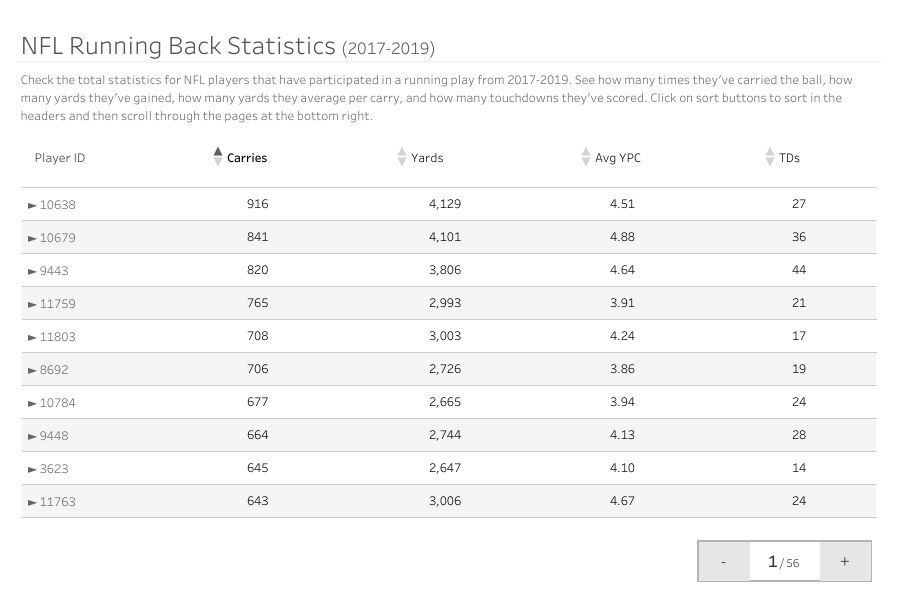
2020 Week 40: #SportsVizSunday and Pro Football Focus

Introduction Hey everyone! I know, this isn’t your monthly #SportsVizSunday data challenge or the weekly thread of awesome sports vizzes, this is #WorkoutWednesday, but with a sports twist. My name is Spencer Baucke, co-founder of #SportsVizSunday and consultant at Tessellation. I was suuuuper excited when the #WoW crew reached out and asked if we wanted …

2020 Week 40: #SportsVizSunday and Pro Football Focus Read More

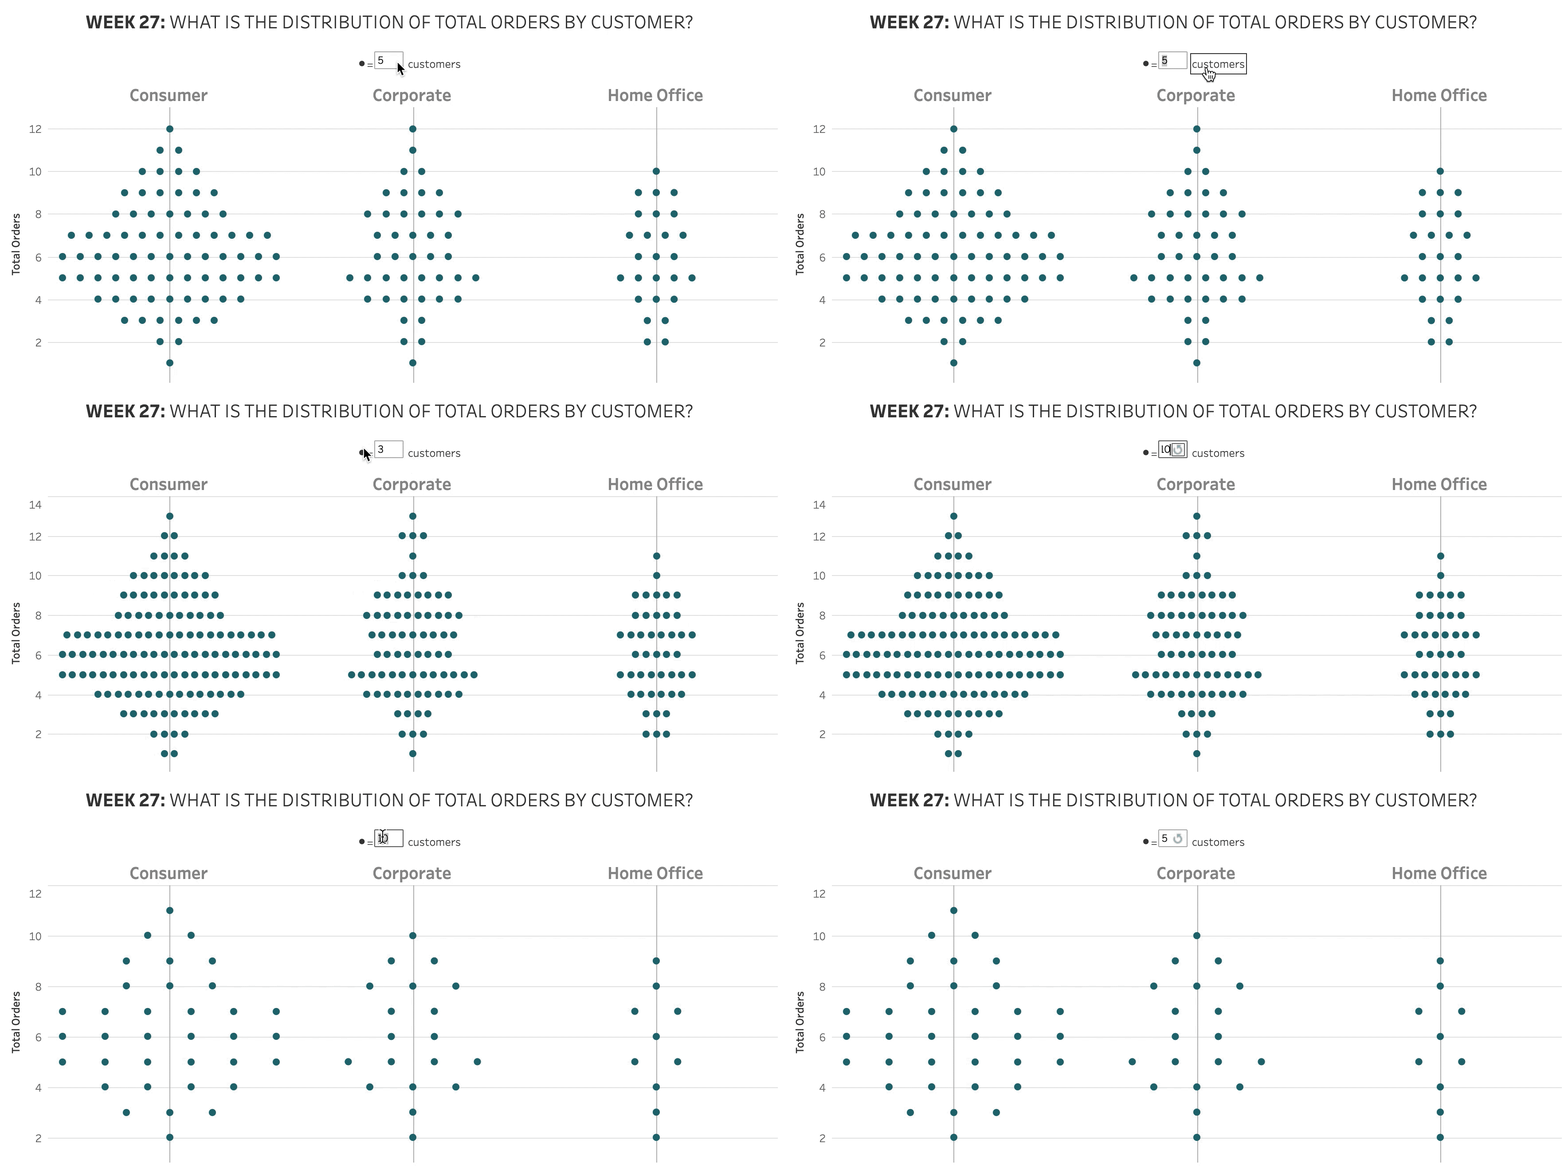
2020 Week 27: What is the distribution of total orders by customer?

Introduction After many weeks of practical challenges. I’ve decided to switch it up this week. If I’m being honest I’ve been saving this challenge since August of last year (it’s still not the oldest challenge I am saving). This weeks challenge is to make a symmetrical dot plot. Not only is the dot plot symmetrical …

2020 Week 27: What is the distribution of total orders by customer? Read More

Scroll to Top