Shannon Lindsay

2023 Week 05 | Power BI: Visualize the Oscars with an Isotype/Pictogram Chart

Introduction Hello and welcome back to Workout Wednesday! If you’re joining us for the first time, be sure to check out our complete list of challenges. This week we’re looking at data from the American Academy Awards, also known as the Oscars. The Oscars are awards for artistic and technical merit for the American film industry …

2023 Week 05 | Power BI: Visualize the Oscars with an Isotype/Pictogram Chart Read More

2023 Week 01 | Power BI: Use DAX to control visual display

Introduction Welcome to Workout Wednesday 2023, Power BI edition! If this is your first time joining us, we’re happy you’re here. The goal of this initiative is to help you build your Power BI skills. We provide the data and the instructions, and you build the visuals! We hope you have fun and learn a new …

2023 Week 01 | Power BI: Use DAX to control visual display Read More

2022 Week 49 | Power BI: Build a Holiday Song Picker

Introduction Welcome back to Workout Wednesday 2022! This week we’re continuing our work with images and building a fun Holiday Song Picker using the Image Grid custom visual in Power BI! We’ll use data from Spotify to help select a song based on Artist, Tempo, or Key. If you’d like to follow along with the …

2022 Week 49 | Power BI: Build a Holiday Song Picker Read More

2022 Week 47 | Power BI: WoW on Twitter

Introduction Welcome back to Workout Wednesday! This week we’re going to visualize Twitter data using Twitter’s API to retrieve tweets that have been made about Workout Wednesday! You have complete creative license to visualize the data in any way that you see fit. If you have a Power BI premium license, I encourage you to …

2022 Week 47 | Power BI: WoW on Twitter Read More

2022 Week 38 | Power BI: Create a Waterfall Pipeline

Introduction Welcome back to Workout Wednesday! This week we’re collaborating with the Tableau team to create a waterfall pipeline using Salesforce data. Lorna Brown, the creator of the challenge is attending Saleforce’s Dreamforce conference, hence the nature of the challenge. We’re building a waterfall chart using the Simple Waterfall custom visual by Datanomy Limited. This week’s workout can be done in …

2022 Week 38 | Power BI: Create a Waterfall Pipeline Read More

2022 Week 33 | Power BI: Compare two series of values

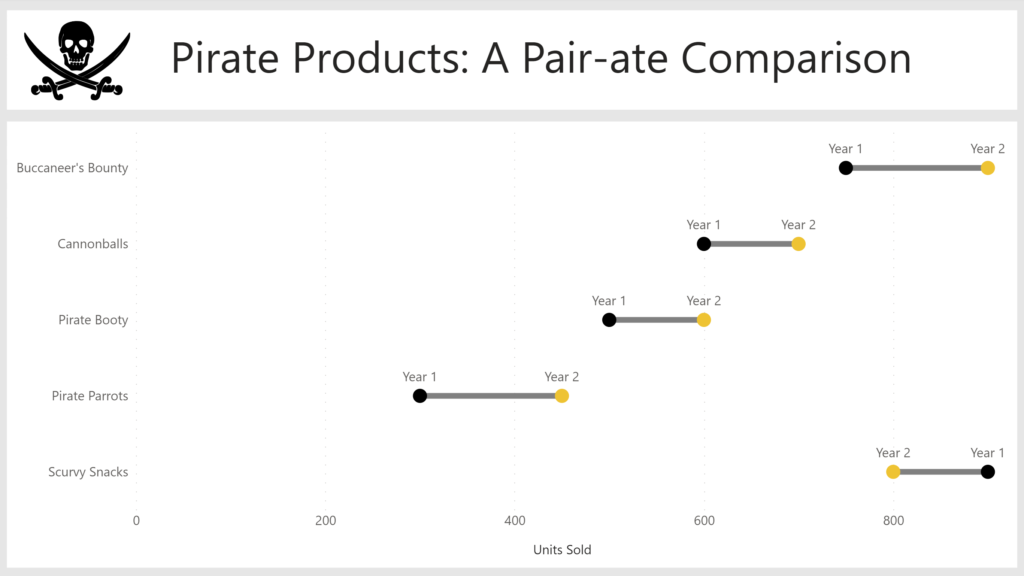
Introduction Welcome back to Workout Wednesday! This week we’re visualizing two series of values in a take on last week’s Tableau challenge! This week’s challenge uses youth cellphone data and gives you the opportunity to either build a dumbbell chart using Charticulator or to build a lipstick column chart using a custom visual. Complete one or both …

2022 Week 33 | Power BI: Compare two series of values Read More

2022 Week 28 | Power BI: Error Bars

Introduction Welcome back to Workout Wednesday! If you’re joining us for the first time, welcome! We present you with a challenge, a dataset to recreate the challenge, and a solution video or file. You can use these challenges to build your skills and your portfolio! This week we’re exploring the error bars feature in Power …

2022 Week 28 | Power BI: Error Bars Read More

2022 Week 23 | Collab with Preppin Data – Salesforce Opportunities

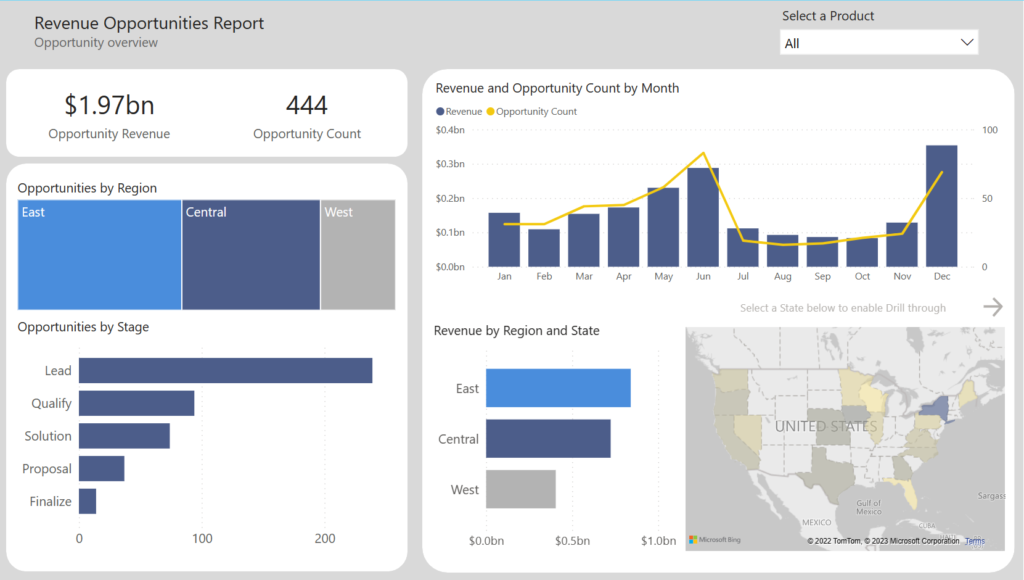
Introduction Welcome back to Workout Wednesday! This week is our annual collaboration with Preppin’ Data and the Tableau team! This week we’re visualizing Salesforce data – looking at current open opportunities, and trying to distinguish the dollar amount of opportunities due to close this month. This week’s challenge can be done in both Power BI and Tableau, and …

2022 Week 23 | Collab with Preppin Data – Salesforce Opportunities Read More

2022 Week 17 | Power BI : Create a Custom Theme

Introduction Welcome back to color month! It’s our 4th color-focused challenge and in stark contrast to Kerry’s week 14 challenge, we’re using loads of bright colors! This week we’re creating a custom theme using the color palette of the United Nations Sustainable Development Goals. This challenge was inspired by a Makeover Monday challenge – take a look …

2022 Week 17 | Power BI : Create a Custom Theme Read More

2022 Week 12 | Power BI: Build a Slicer Panel

Introduction Welcome back to Workout Wednesday – we’re glad you’re here! This week, we’re continuing on with our project management theme. We’re tracking project progress using data generated from Microsoft Planner. Using Power BI with Planner (as opposed to using the inbuilt charts) enables us to both customize visuals and to view more than one plan at …

2022 Week 12 | Power BI: Build a Slicer Panel Read More

Scroll to Top