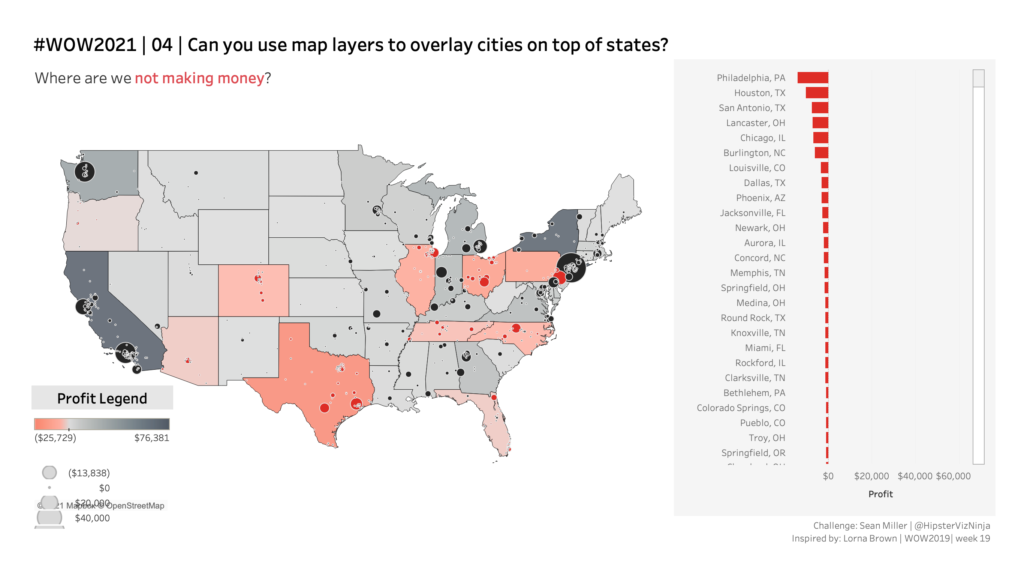
WOW2021 week 04 | Tableau: Can you use map layers to show profit at state and city levels
Hot off the presses of 2020.4, Tableau has introduced map layers. Check out this challenge to learn how to build maps in Tableau with multiple map layers
Hot off the presses of 2020.4, Tableau has introduced map layers. Check out this challenge to learn how to build maps in Tableau with multiple map layers
Introduction Is it too late now to start the post with Happy New Year? Well it’s my first Workout of the year so Happy New Year everyone, it’s really great to be back for my third year! After completing the first two workouts from this year (because I suck at Table Calculations), I wanted to …
2021 Week 3 | Tableau : Can you build a Control Chart Read More »
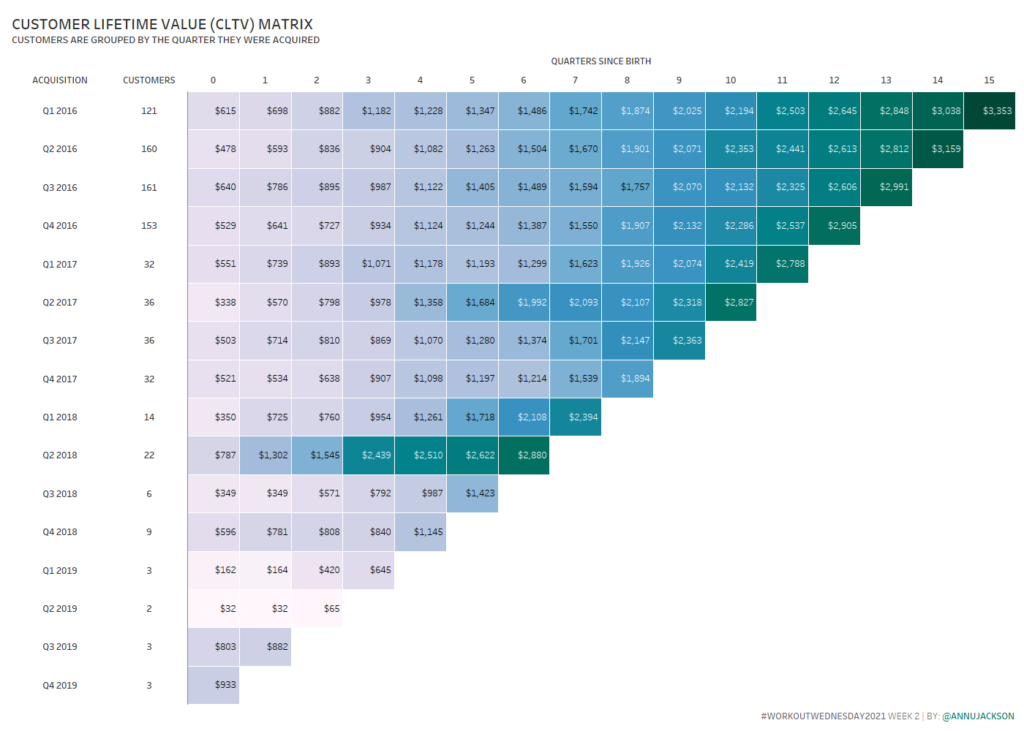
Introduction This year we’ve made a commitment to start with the basics and build, so this challenge is designed to do just that. This week, you’ll be constructing a Customer Lifetime Value Matrix (CLTV). This viz is frequently used in marketing and retail industries to understand the value of each customer. Specifically, the interesting insights …
2021 Week 2 | Tableau : Can you build a Customer Lifetime Value Matrix? Read More »
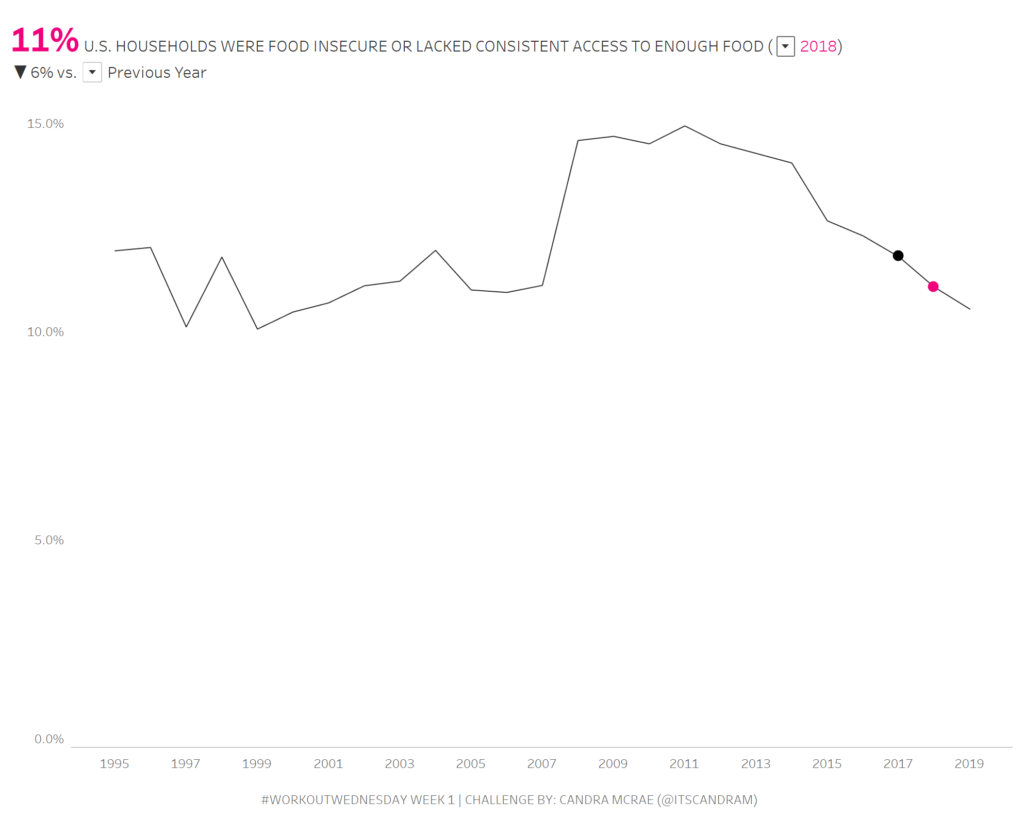
Introduction For the longest time, I avoided table calculations as much as I could because I thought they were overly complicated (compute using…relative to…sort by…nested…ughhhh) especially when I had LODs in my back pocket. But, over time, I’ve made my peace with them (dare I say, a fan now) as I recognized how powerful they …
2021 Week 1: Can You Find the Variance Along the Line? Read More »
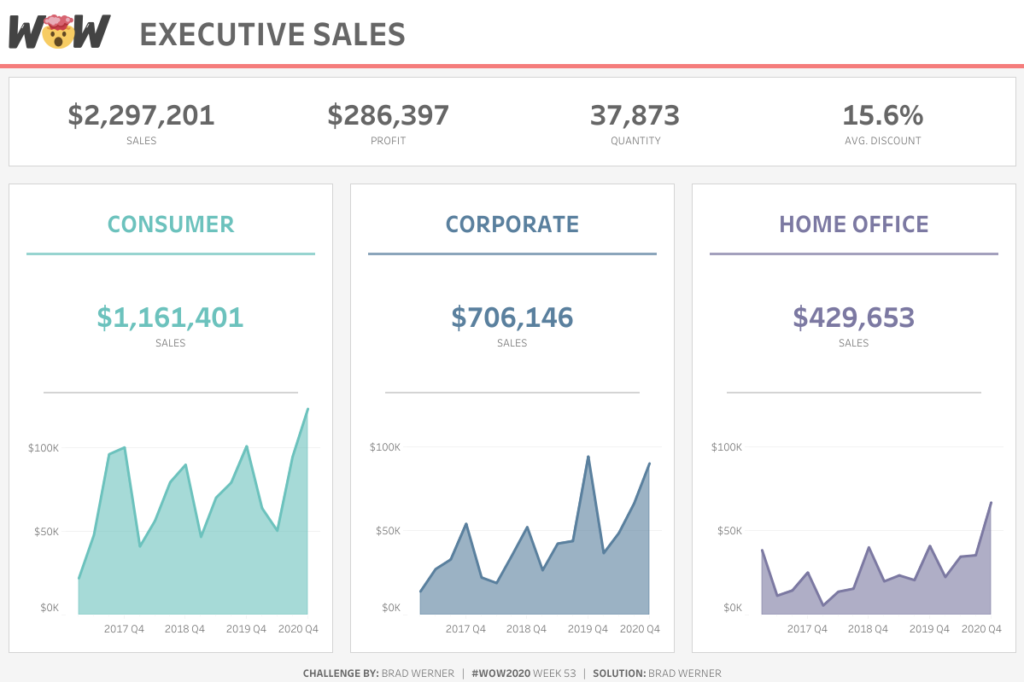
Introduction Brad Werner is responsible for this week’s Workout Wednesday Challenge. Here are all the details in Brad’s own words: I have a confession. When I first started using Tableau, I was a strict advocate for #TeamFloating. Yes, I used to float ALL objects on my Tableau dashboards. I would decide on a dashboard layout …
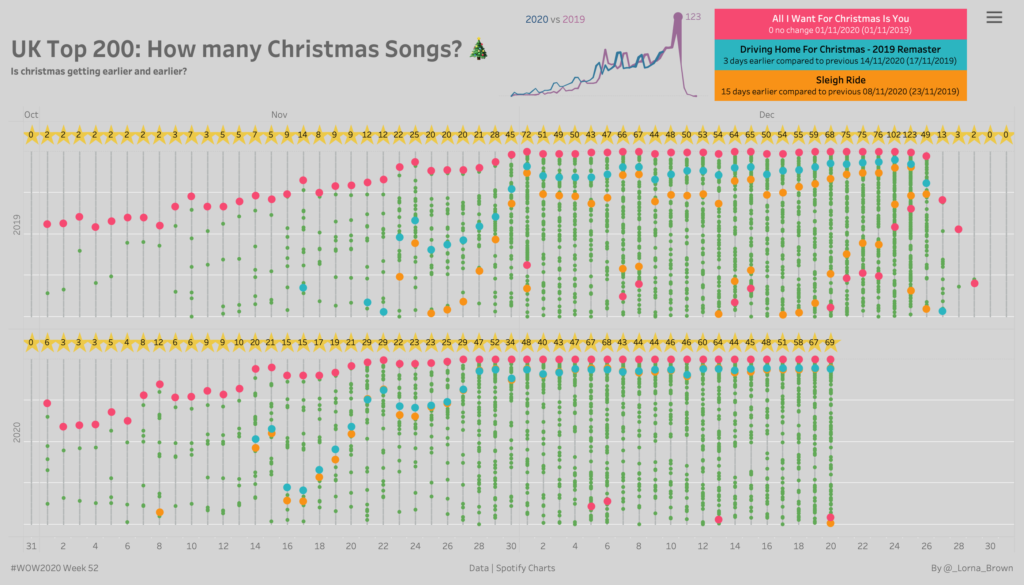
Introduction It feels like it has been a very long time since my last Workout Wednesday, but here I am with my last one of the year. I thought we would have a little bit of fun with some Christmas Songs Data. The data contains top 200 songs everyday from 31/10 to 31/12. This currently …
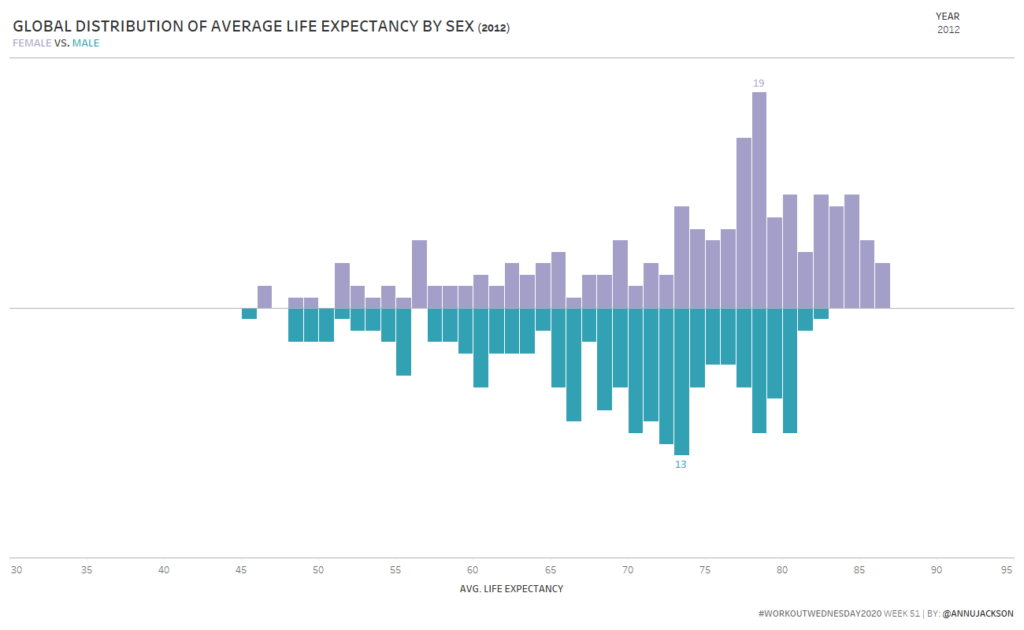
Introduction This is my last Workout Wednesday for 2020 (don’t worry, I’ll be back in 2021!), so I thought I’d take it easy on everyone. This week you’ll be building a single chart – a divergent histogram. I first saw a divergent histogram via the Economist almost 3 years ago and tagged it as a …
2020 Week 51: Can you build a Divergent Histogram? Read More »
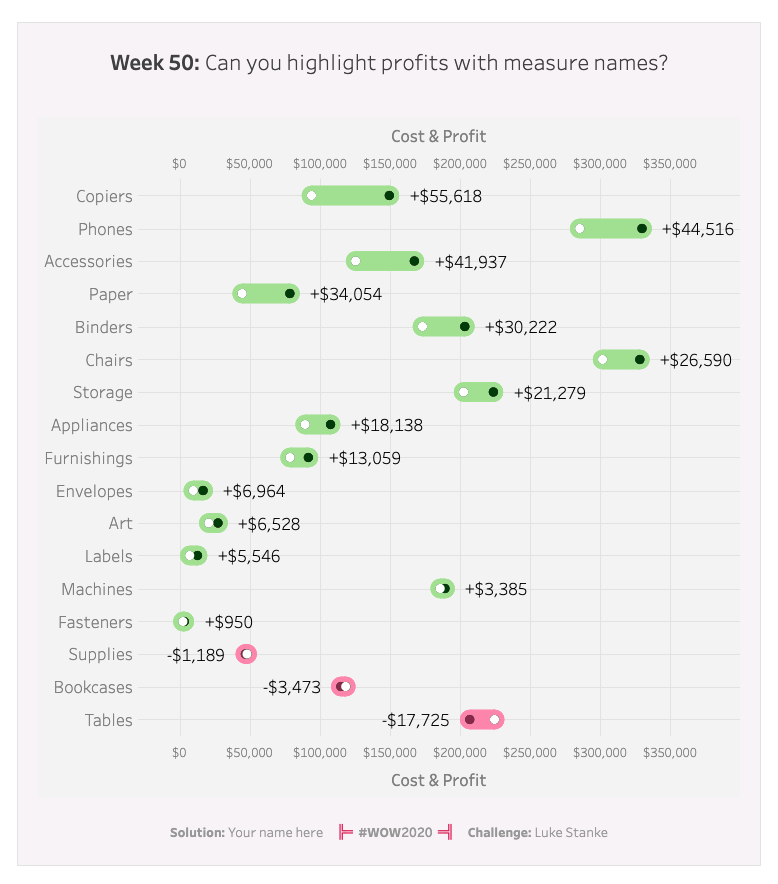
Introduction This week we are throwing it back to using measure names and measure values. There are two levels to this challenge: Level 1 Showing the visualization as is, but without the circles around the white dots in each line Level 2 Adding a ring around the white dots on the viz. There is no …
2020 Week 50: Can you highlight profits with measure names? Read More »
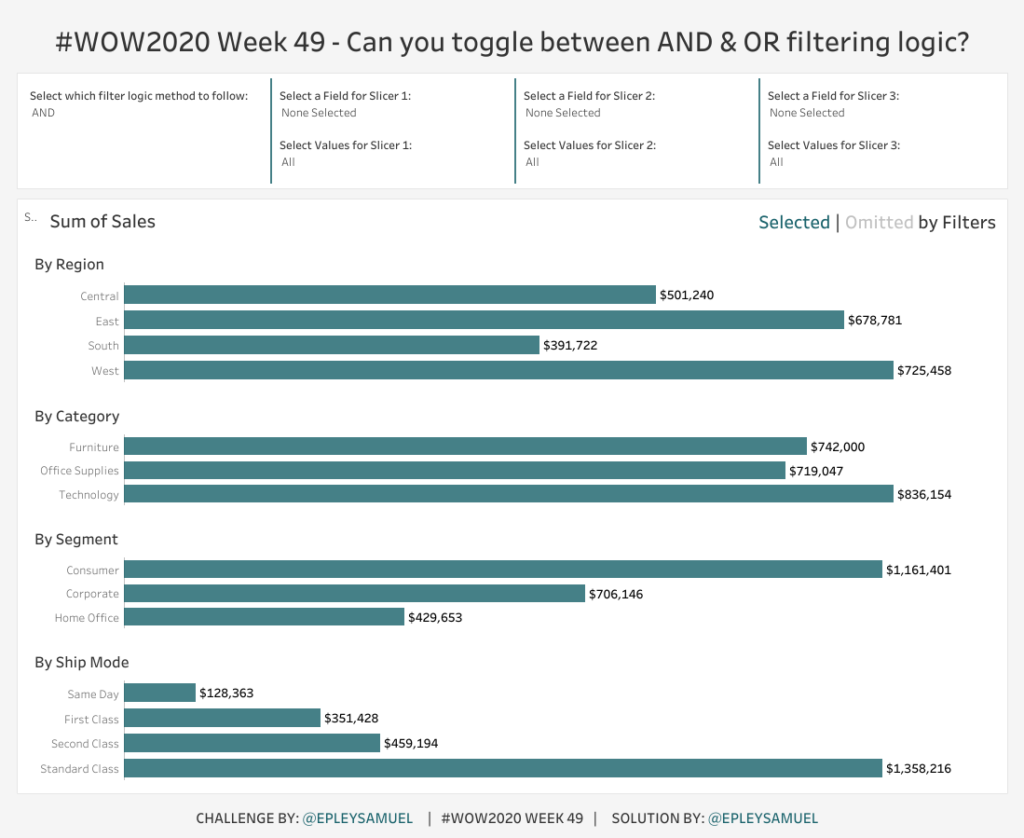
Introduction Sam Epley (100% completion club #WOW2020) is responsible for this week’s Workout Wednesday Challenge. Here are all the details in Sam’s own words: Several months ago, I was working with a client who wanted to provide their end user with some pretty clever functionality I’d never seen before. They wanted their user to be …
2020 Week 49: Can you toggle between AND & OR filtering logic? Read More »
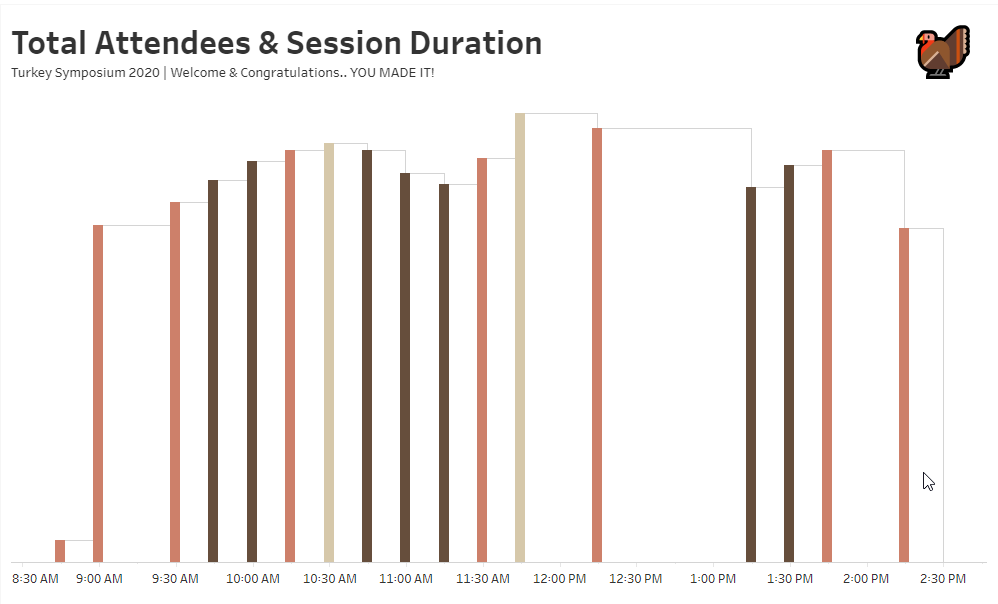
Introduction Jami Delagrange is responsible for this week’s Workout Wednesday Challenge. Here are all the details in Jami’s own words: Similar to Ann’s experience with the Clustered Histogram (last week’s challenge), I had an idea recently where I knew how to do the individual parts and wasn’t sure how to put them together. I knew how …
2020 Week 48: Can you create a Variable Width Bar Chart? Read More »