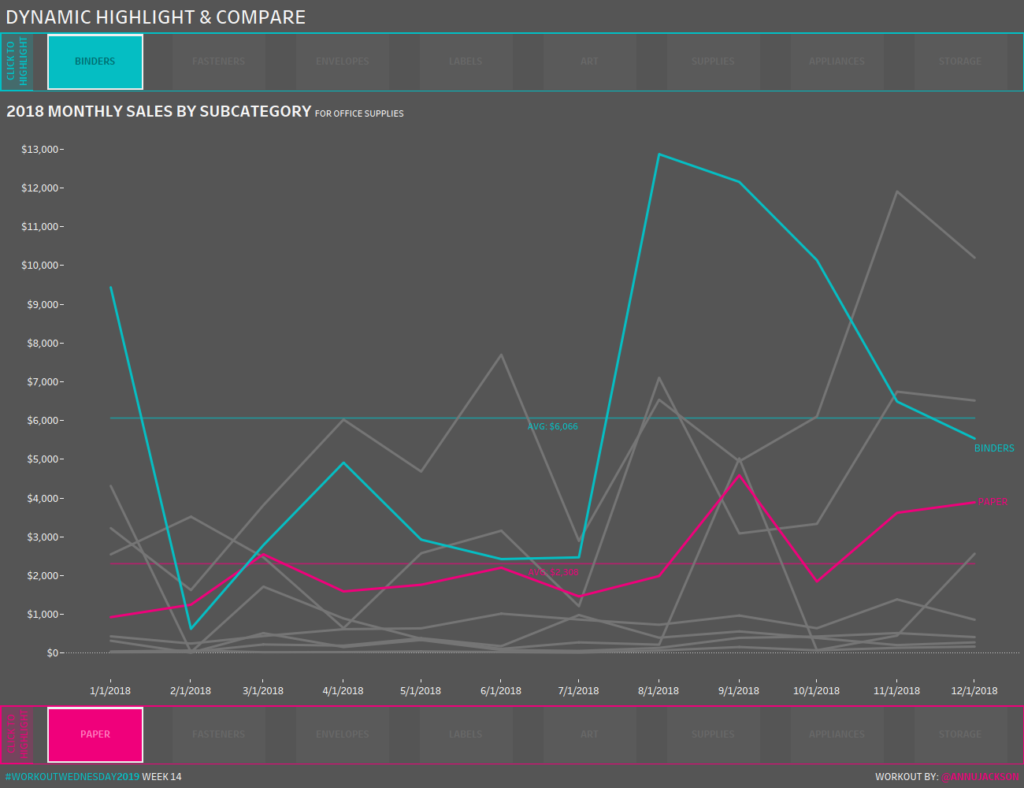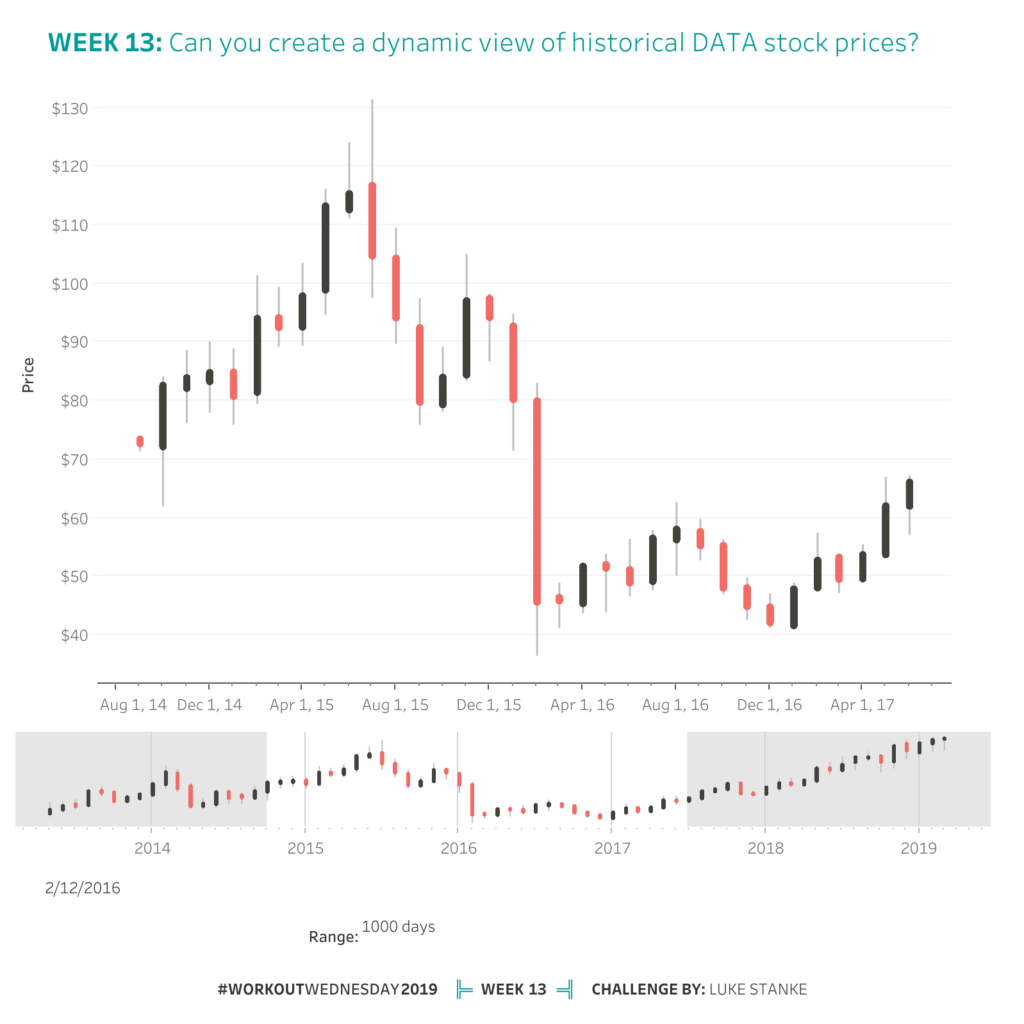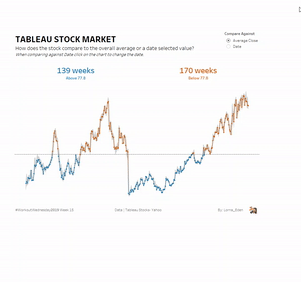
2019 Week 15: Tableau Stock Market – How does the stock compare to the overall average or a date selected value?
Sets, Glorious Sets. Was what I tweeted out earlier this week, as I was finishing off my IronViz entry for Europe! Sets and set actions are super powerful and there are so many use cases. This week we take a look at the Tableau Stock market, using the almighty SET ACTIONS, and obviously it includes …