2022 Week 32 | Leverage Field Parameters in Measures
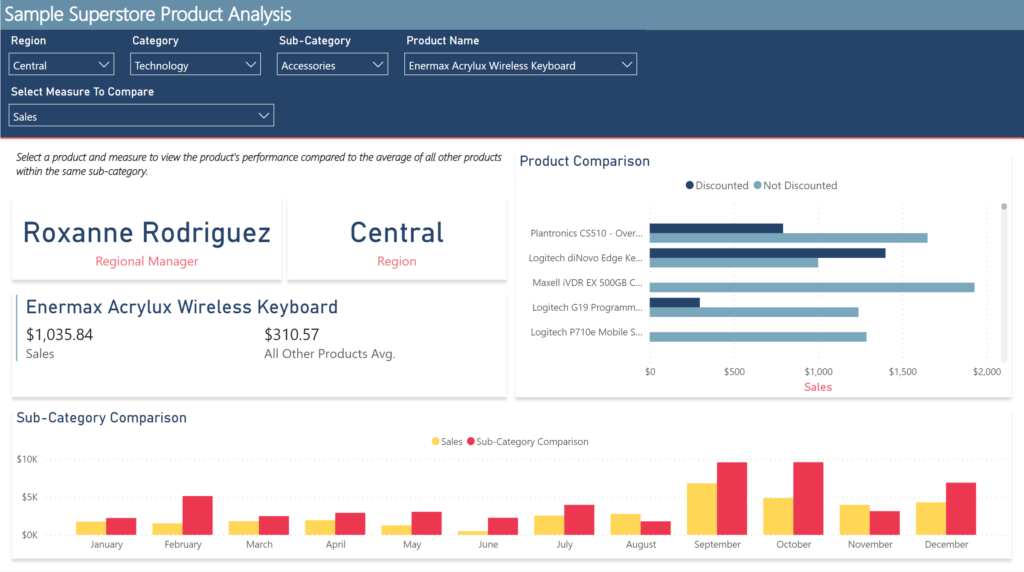
Introduction My name is Spencer Hamilton, Analytics Consultant with phData, and I’ll be guest hosting this week’s challenge! For the challenge, we’re going to look at one of Power BI’s newer features, Field Parameters, and create some calculations that dynamically change based on the selected parameter value. In this specific example we’re looking at Sample […]
2022 Week 32 | Leverage Field Parameters in Measures Read More »
Power BI, Workout Wednesday