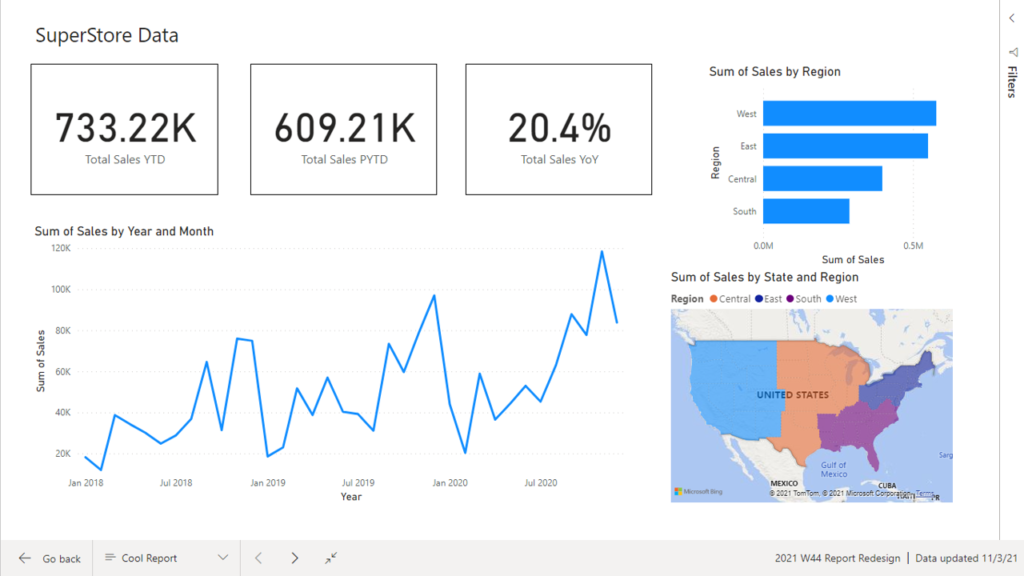
2021 Week 45 | Power BI: Create a Custom Navigation Experience
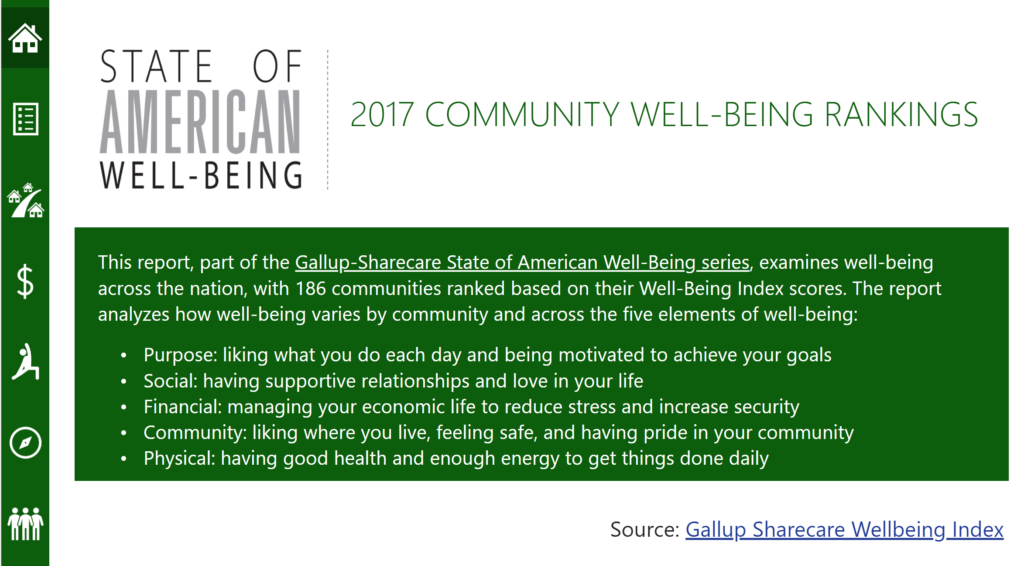
Introduction We hope that you had a lot of fun last week re-designing Spencer’s report! This week we’re also focusing on design and creating a custom navigation experience using bookmarks and buttons. I am looking for a new place to live and stumbled upon the 2017 State of American Well-Being report. This PDF report details community well-being […]
2021 Week 45 | Power BI: Create a Custom Navigation Experience Read More »
Power BI, Workout Wednesday