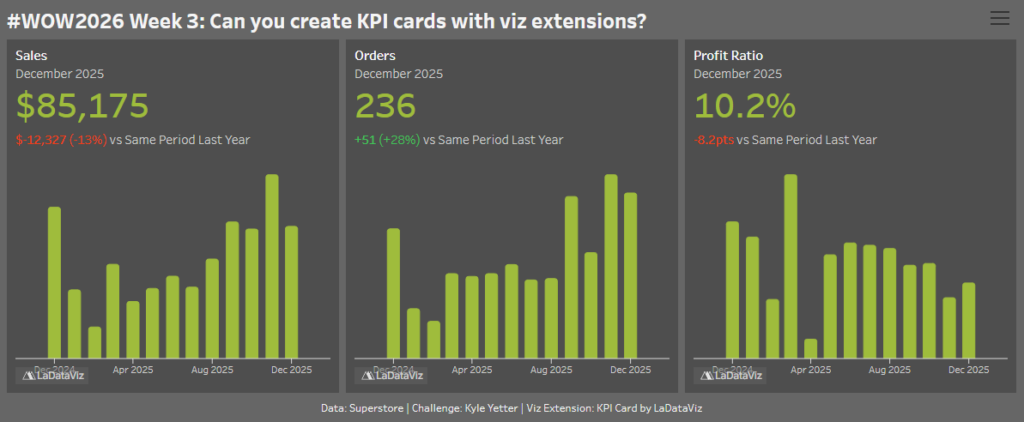
Workout Wednesday

#WOW2025 | Week 22 | Data Normalization Methods

Introduction This week’s challenge is inspired by Robbin Vernooij & Lorna Brown’s talk from Tableau Conference this year (TC25) titled ‘Taming the Beast: Normalization Strategies in Tableau’ Normalization allows us to examine the relative importance of values that may be on completely different scales. A common example of where we use normalization is when we …

#WOW2025 | Week 22 | Data Normalization Methods Read More »

2025 Week 21 | Power BI: Scatterplot / Timeseries Smoothing

Introduction When looking at timeseries data, we may encounter high variability from one week to the next, creating highly jagged and difficult to read charts. There are a number of techniques to smooth the lines to better depict trend. Some may use rolling averages, others, like YouGov, use LOESS regression. https://yougov.co.uk/topics/society/trackers/how-often-brits-exercise In this weeks challenge …

2025 Week 21 | Power BI: Scatterplot / Timeseries Smoothing Read More »

#WOW2025 | Week 20 | Let’s Practice Multi-fact Relationship Data Model

Introduction In this challenge, we will explore the Multi-Fact Relationship Data Model feature introduced in the 2024.2 version. This feature enables us to seamlessly connect and analyze multiple fact tables within a single data source. It’s exciting as a Tableau datasource can behave like a small database! Here are some materials for those who are …

#WOW2025 | Week 20 | Let’s Practice Multi-fact Relationship Data Model Read More »

2025 Week 20 | Year-over-Year Selected Metric Trends

Introduction Welcome to Week 21 of 2025! This report allows users to select a performance metric (e.g., Revenue) and compare its values across 2024 and 2023. It provides a flexible way to explore year-over-year changes and spot trends or anomalies through interactive visuals. Good luck! -Andrei Requirements Main Visual: Area Chart with Year-on-Year Comparison Green …

2025 Week 20 | Year-over-Year Selected Metric Trends Read More »