Introduction
You probably have heard of the Pareto Principle before. And if not under that name, you might have heard of the 80:20 rule which states that for many use cases, 20% of the input create 80% of the output. For example, for many projects 20% of the work is required to get you 80% to the target but then you spend a ton of time on those small changes and adjustments to deliver it successfully. In most companies, about 20% of their largest customers make up 80% of their revenue, etc.
You shouldn’t take it as a rule but once you pay attention, you can see approximations in many places.
Anyway, today we create a chart that tells us how much the largest x% of our customers contribute to our business.
Requirements
- All calculations will be done in SAQL, no recipe is needed
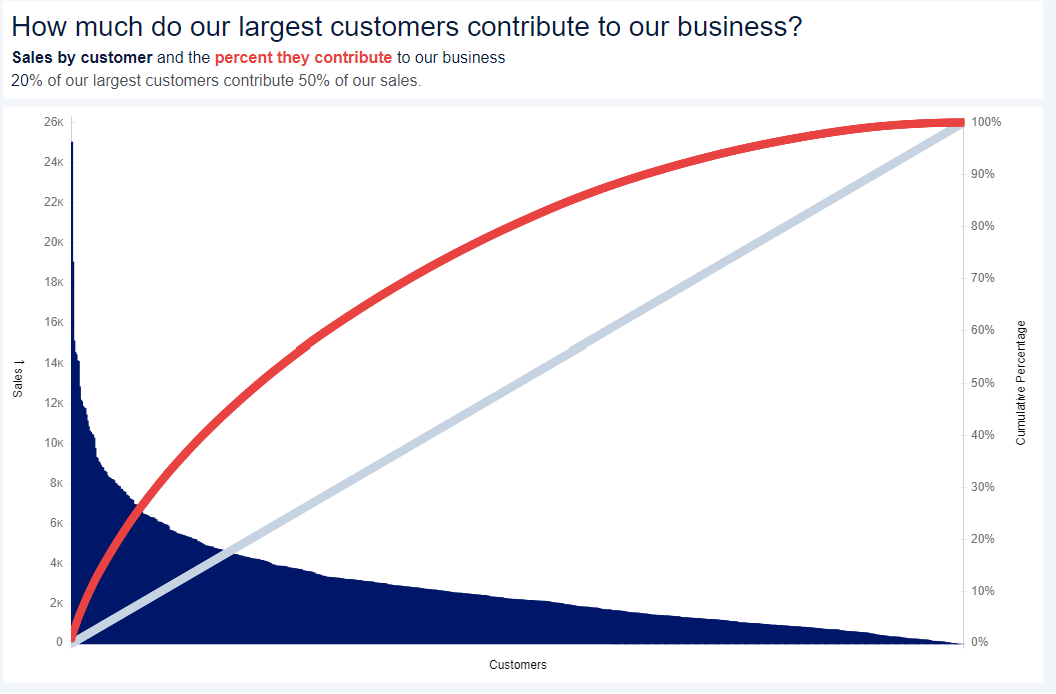
- Chart
- the blue area is the customers ordered by total sales (largest to smallest)
- The red line is the cumulative percentage that those customers contribute to the total sales
- The grey line indicates the percentage of total customers
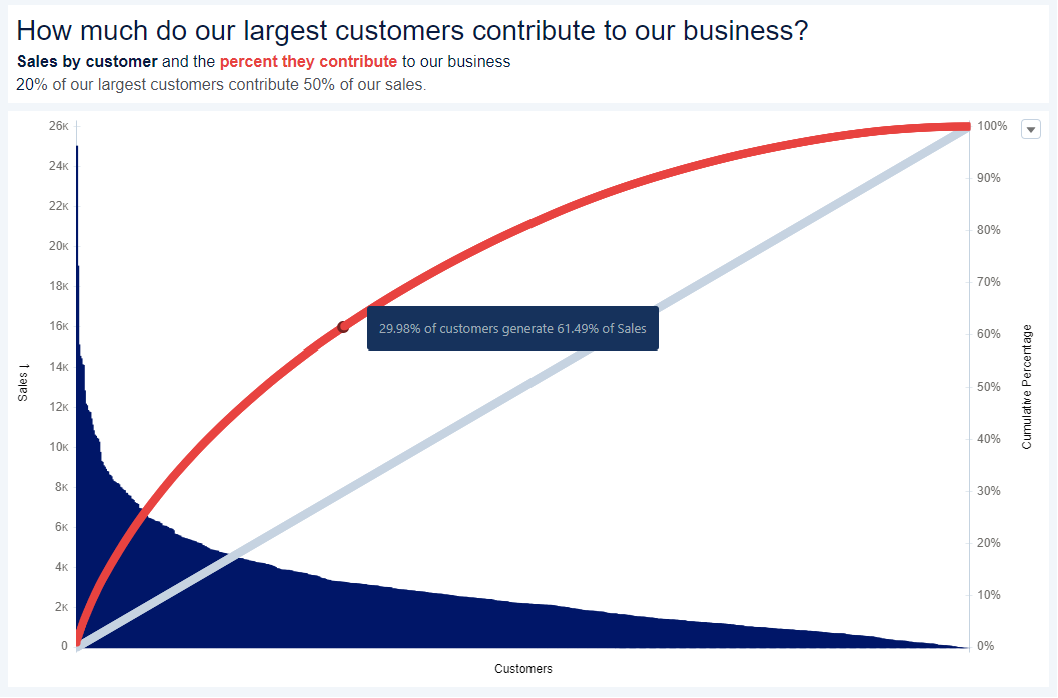
- Match the tooltip to give more accurate information
- Match all formatting for headlines, axis, labels, etc.