Introduction
Another month another week and we are already in the second quarter of the year! Let’s start this quarter strong and use timeseries in dashboards.
This week is based on similar dataset as the week 4 and 9 but has been organized by energy types as a column! The challenge is to create a dashboard that works with Entity (Country) and the Energy Type (Fuel) to predict how the existing data should have been and predictes the next 3 years! Here we go! And have fun.
Requirements
- Create a dev org or use an existing org you have access to
- Load the dataset into CRM Analytics provided below.
- Start a new dashboard and create a timeseries analysis that uses two dimensions and a year (date field) to predict. (Hint: You will need SAQL.).
- Add % variance as a column.
- Filter the dataset using the input widget to find anything greater than the number in the input widget.
- Use conditional formatting to color code the % variance column.
- Clone the table and add it to the second tab to show the future.
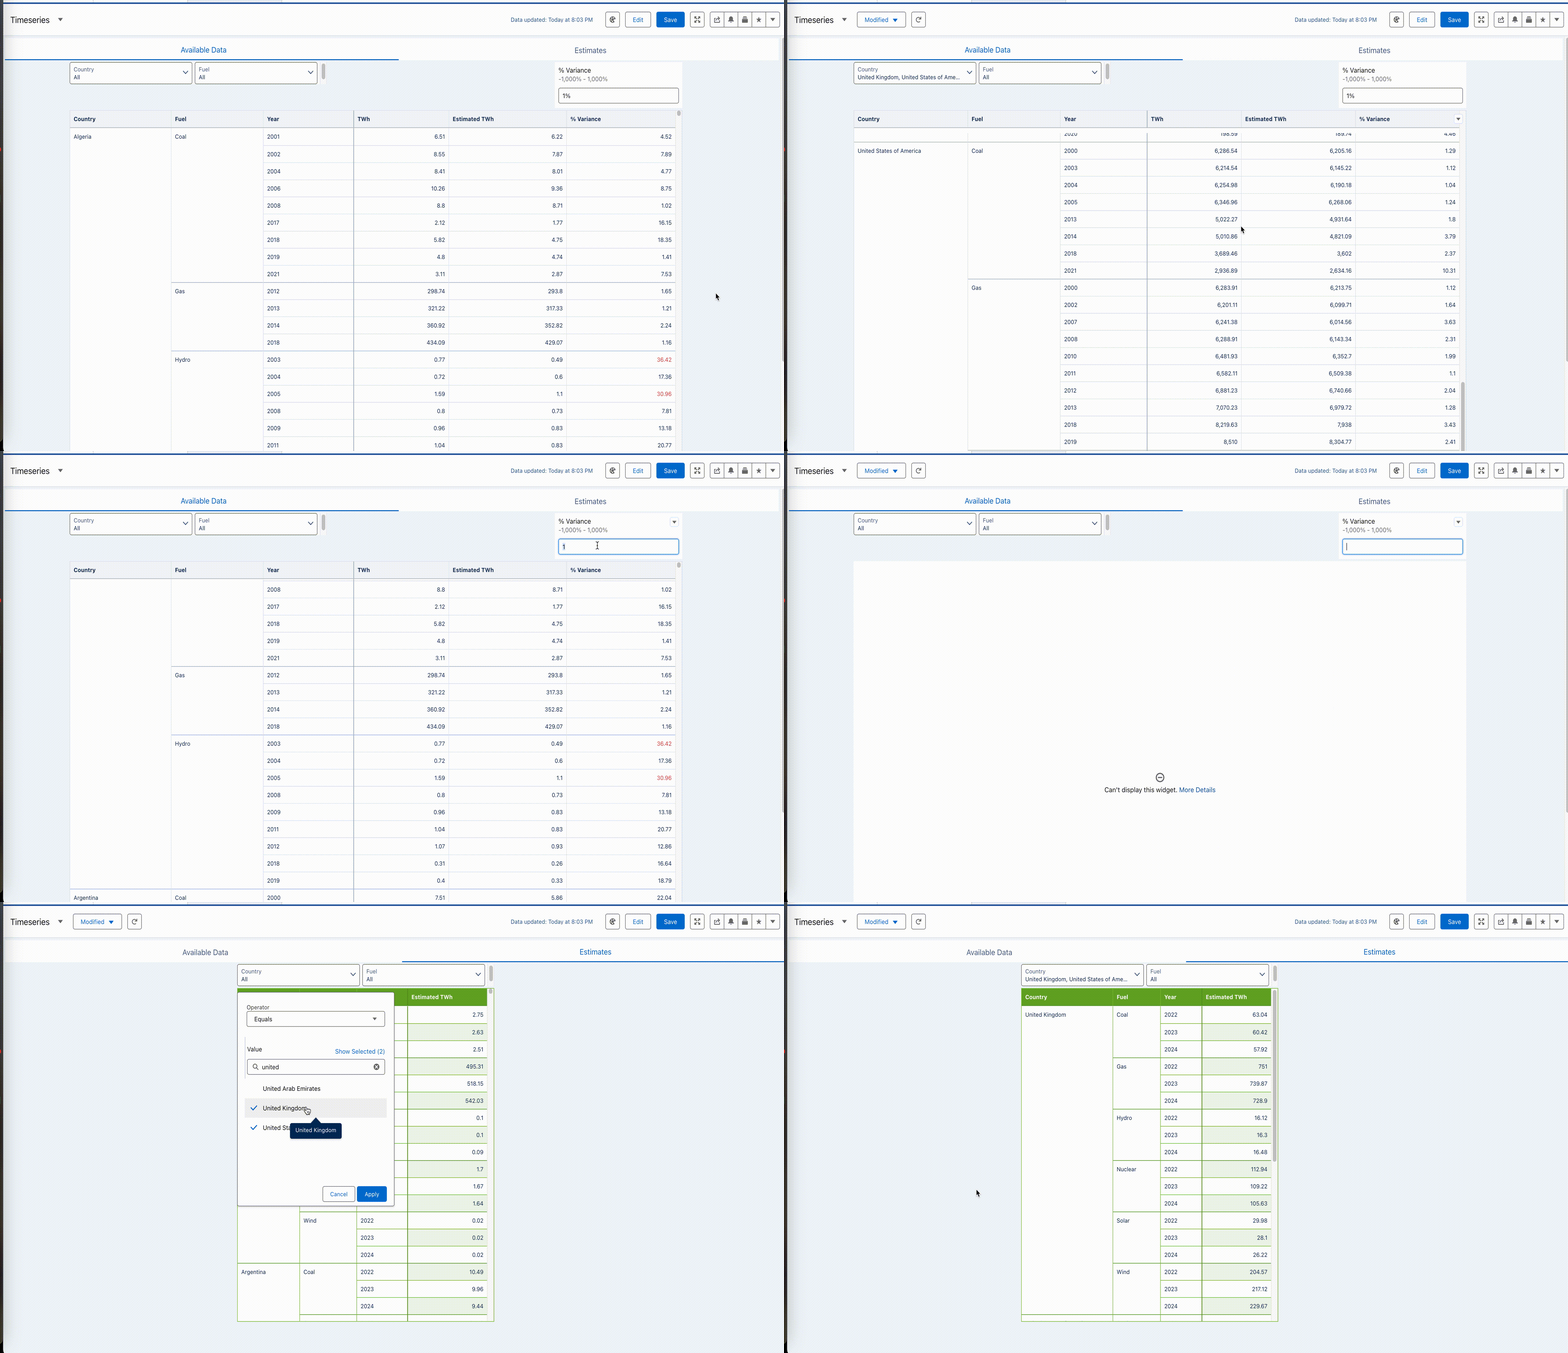
The resulting dataset should look something like this:

Use SAQL
Dataset
https://data.world/sayantanim/energy-data-for-timeseries-analysis
Share
After you finish your workout, share a screenshot of your solutions or interesting insights.
Either on Twitter using the hashtags #WOW2024 and #CRMA and tag @genetis, @LaGMills @msayantani, and @simplysfdc. (Or you can use this handy link to do that)
Or on LinkedIn, tagging Alex Waleczek, Lauren Mills, Sayantani Mitra, Phillip Schrijnemaekers and Johan Yu using the hashtags #WOW2024
Also make sure to fill out the Submission Tracker to track your progress and help us judge the difficulty of our challenges.


