Introduction
Thanks to everyone who has ben participating in #WorkoutWednesday – Power BI edition! We have had an amazing 953 submissions for the Power BI challenges at the time of writing this post. If you haven’t been submitting your tracker upon completion, make sure to fill it out at this link.
This week we are going to be diving into a brand new feature native to Power BI Desktop and that is CHARTICULATOR! This tool has endless possibilities in terms of design and custom formatting, but this week we are going to be giving a basic overview of how to use the tool. See the example lollipop chart below that I created in Charticulator that we will be recreating in this week’s challenge.
Requirements
- Connect to the Superstore sample data set available on data.world
- Create a lollipop chart using the Charticulator template
- The lollipop chart needs to show SUM(Sales) by State (y-axis)
- Color the State fields by Region
- Change the title to say Sales by State
- Make legend horizontal and fit under the chart title
- Add in horizontal slicer to allow slicing by Year of Order Date
Dataset
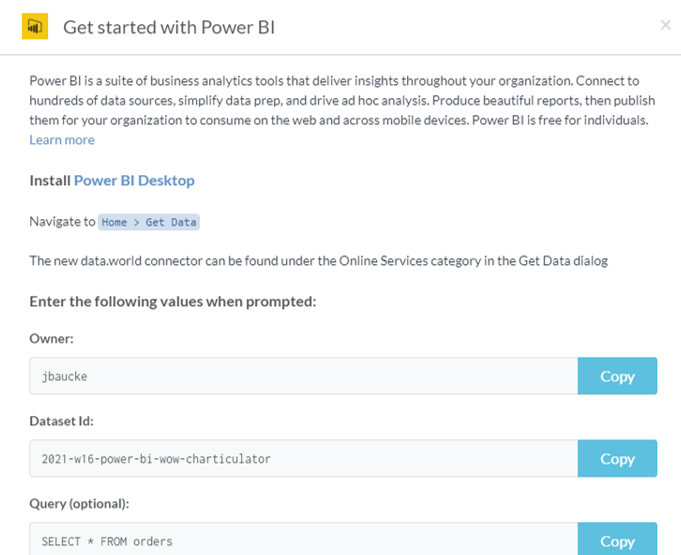
This week we use the infamous Superstore data set that comes from Tableau as an example data set in their desktop tool. I have saved this data set to Data.World. You can connect to this data using the connector (Beta) in Power BI Desktop. Please see the required fields below that you will need to populate.

Share
After you finish your workout, share on Twitter using the hashtags #WOW2021 and #PowerBI, and tag @JSBaucke, @MMarie, @shan_gsd and @dataveld. Also make sure to fill out the Submission Tracker so that we can count you as a participant this week in order to track our participation throughout the year.


