
My name is Spencer Hamilton, Analytics Consultant with phData, and I’ll be guest hosting this week’s challenge! For the challenge, we’re going to look at one of Power BI’s newer features, Field Parameters, and create some calculations that dynamically change based on the selected parameter value.
In this specific example we’re looking at Sample Superstore data and creating a product analysis report that lets the user compare specific product sales relative to others in the same sub-category based on the slicers selected in the report. We have a field parameter to toggle between sales, profit, and quantity so that the user can quickly select which metric they would like to compare and the visuals all update accordingly.
While there are several intrinsic benefits to using field parameters for things like switching measures or KPI’s or changing categories for your visuals, I wanted to see if I could limit the amount of user clicks when comparing values by creating a calculation that could change the value and metric being compared whenever the field parameter is changed.
While this exercise is pretty straight forward for say, comparing sales of one product to sales of another product, it becomes a little bit trickier if you want to compare sales, profit, or quantity with a single measure. Add in the fact that Power BI can’t traverse a table relationship between a field parameter table and your new measure and things get even murkier.
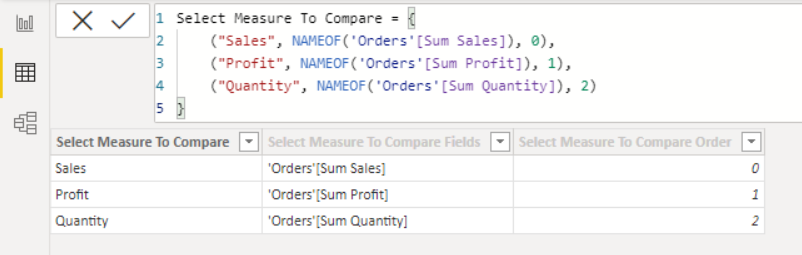
Even though it isn’t as simple as a measure to measure comparison, we are able to use the field values from our field parameter to essentially “anchor” the user’s selection to the correct measure that we want to use for our comparison. As you’ll see in the exercise, when you create a field parameter Power BI creates an additional hidden field that serves as the lookup column for finding the associated field in your other table. This column is automatically generated, and is named with your parameter name plus “Fields” on the end.
Using this generated column, we’ll create a few IF statements to set the condition for our comparison measure and pull in the selected slicer values to limit the data included in the calculation. As a hint, to get appropriate average values for the other products/categories you’ll want to set the level that Power BI is summarizing the data before you calculate your average.
Below is the product analysis overview I put together. If I wanted to add some additional flavor to the report, I might consider throwing a smart narrative together that outlines the bottom line for managers, including what % of total sales the specific product is responsible for and how discounts might affect profitability. But for this week I just wanted to focus on creating some nifty comparisons with the new field parameter feature!