About three years ago, I was participating in our weekly Makeover Monday group at work, and happened to immediately know what I wanted to build and got it done in about 40 minutes. A colleague also completed theirs in that time, and so we then shared what we had built with the rest of those in attendance. A couple people asked how we built it, and identified that they were more interested in learning how to build things in Tableau vs why we chose a certain chart, etc. That moment led to starting weekly Workout Wednesday sessions of solving live with the group, and eventually led to my increased participation and becoming part of the Workout Wednesday team. This week we are revisiting that visualization, a dumbbell chart.
I originally learned how to build a dumbbell chart from Ryan Sleeper here, to give you a start on how to build.
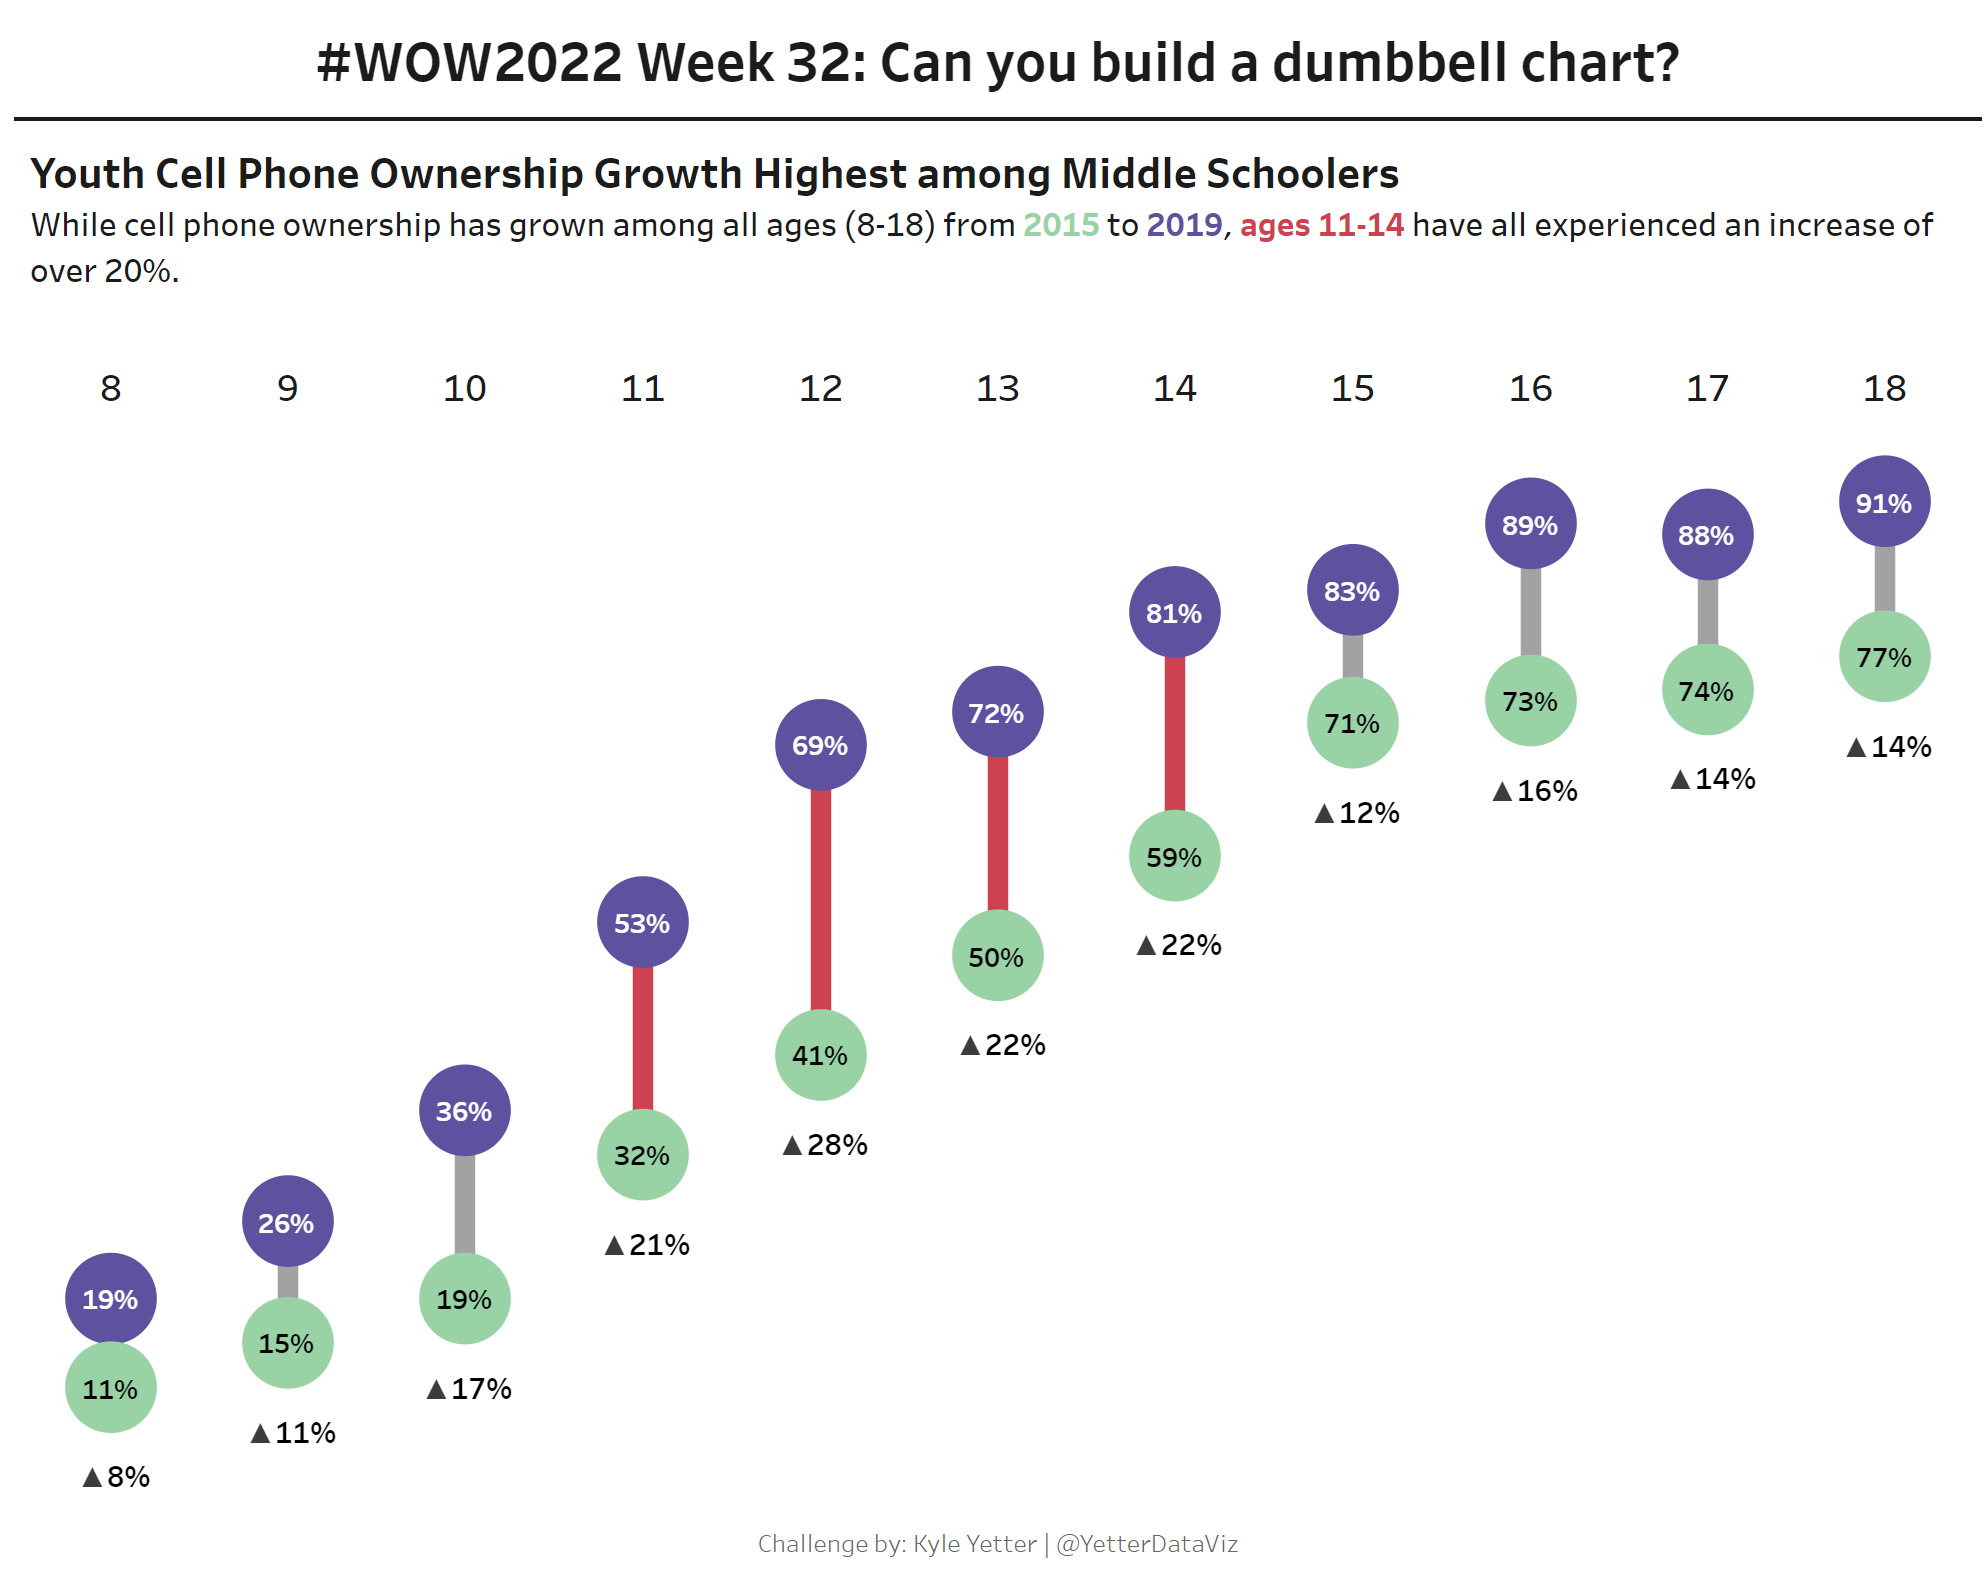
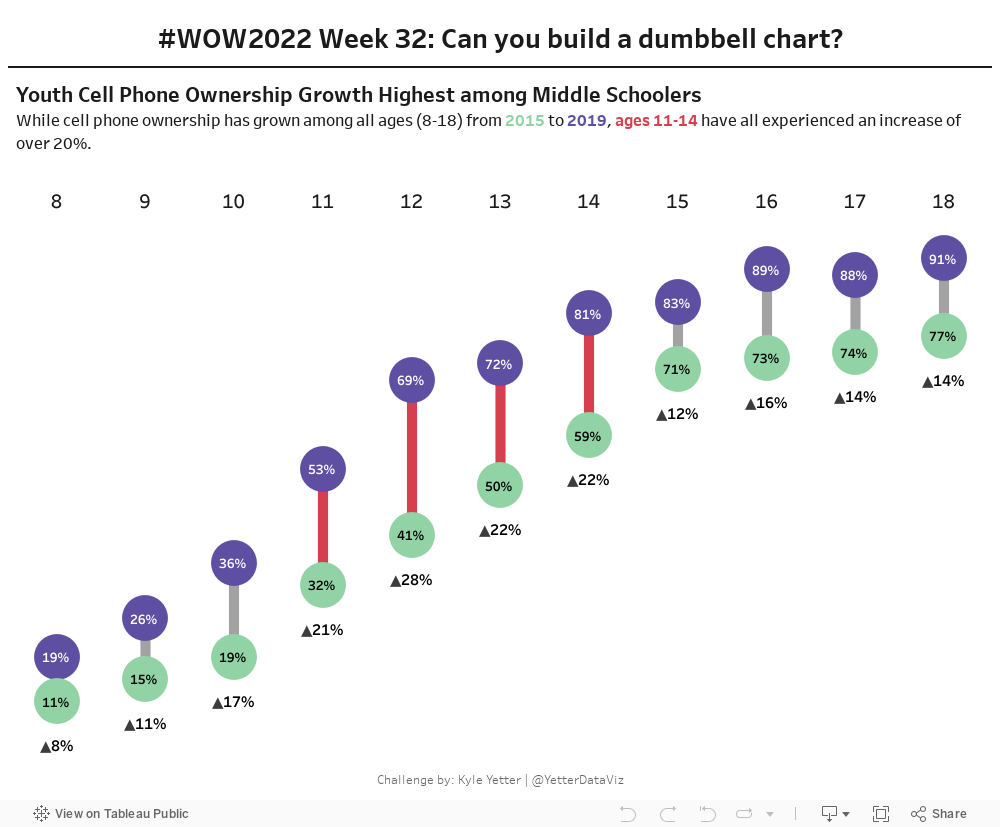
Create a dumbbell chart showing 2015 vs 2019 phone ownership by age
Bars for age 11-14 should be different color (#d6404e) than others in gray (#a2a2a2)
Circles should be labelled with % ownership
Dumbbells should have the difference between 2015 and 2019 labelled below
Age headings should be at the top of the chart, NOT the bottom
Match tooltips and formatting
Dataset
This week uses a Makeover Monday data set. You can find it here on Data.World
Attribute
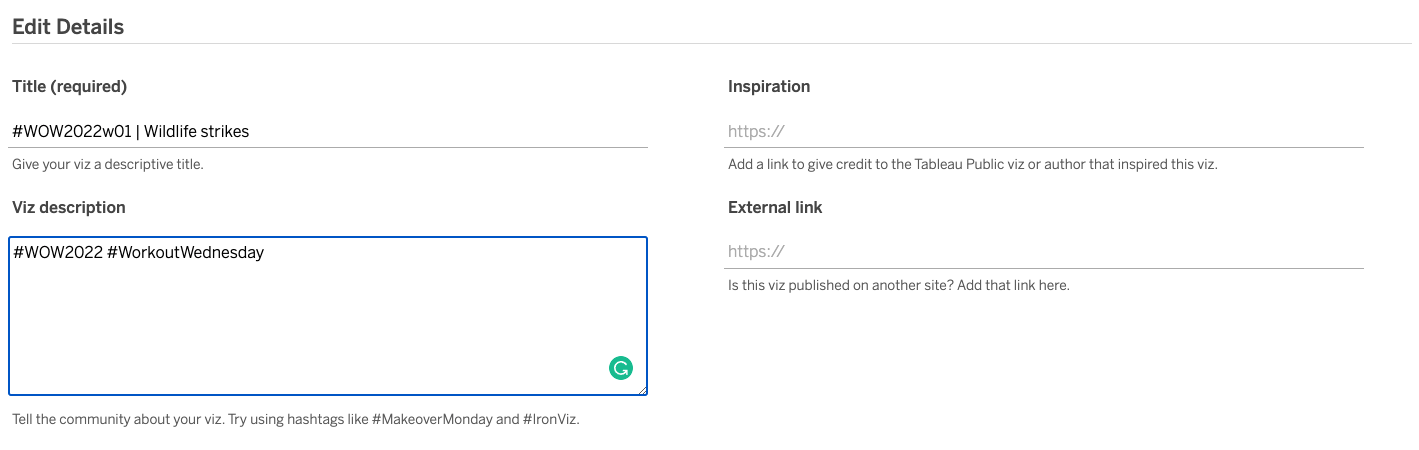
When you publish your solution on Tableau Public make sure to take the time and include a link to the original inspiration. Also include the hashtag #WOW2022 in your description to make it searchable!