Introduction
Welcome back to Workout Wednesday! I’ve been getting so much of my inspiration from the community lately, and this week’s challenge is no exception!
Recently, Andy Kriebel posted a cool calendar filter on LinkedIn, that he built using Tableau. Our very own guest contributor and friend Erik Svensen took Andy’s post and re-created it in Power BI! If you’re interested in dataviz in any tool, I highly recommend you give both of these legends a follow.
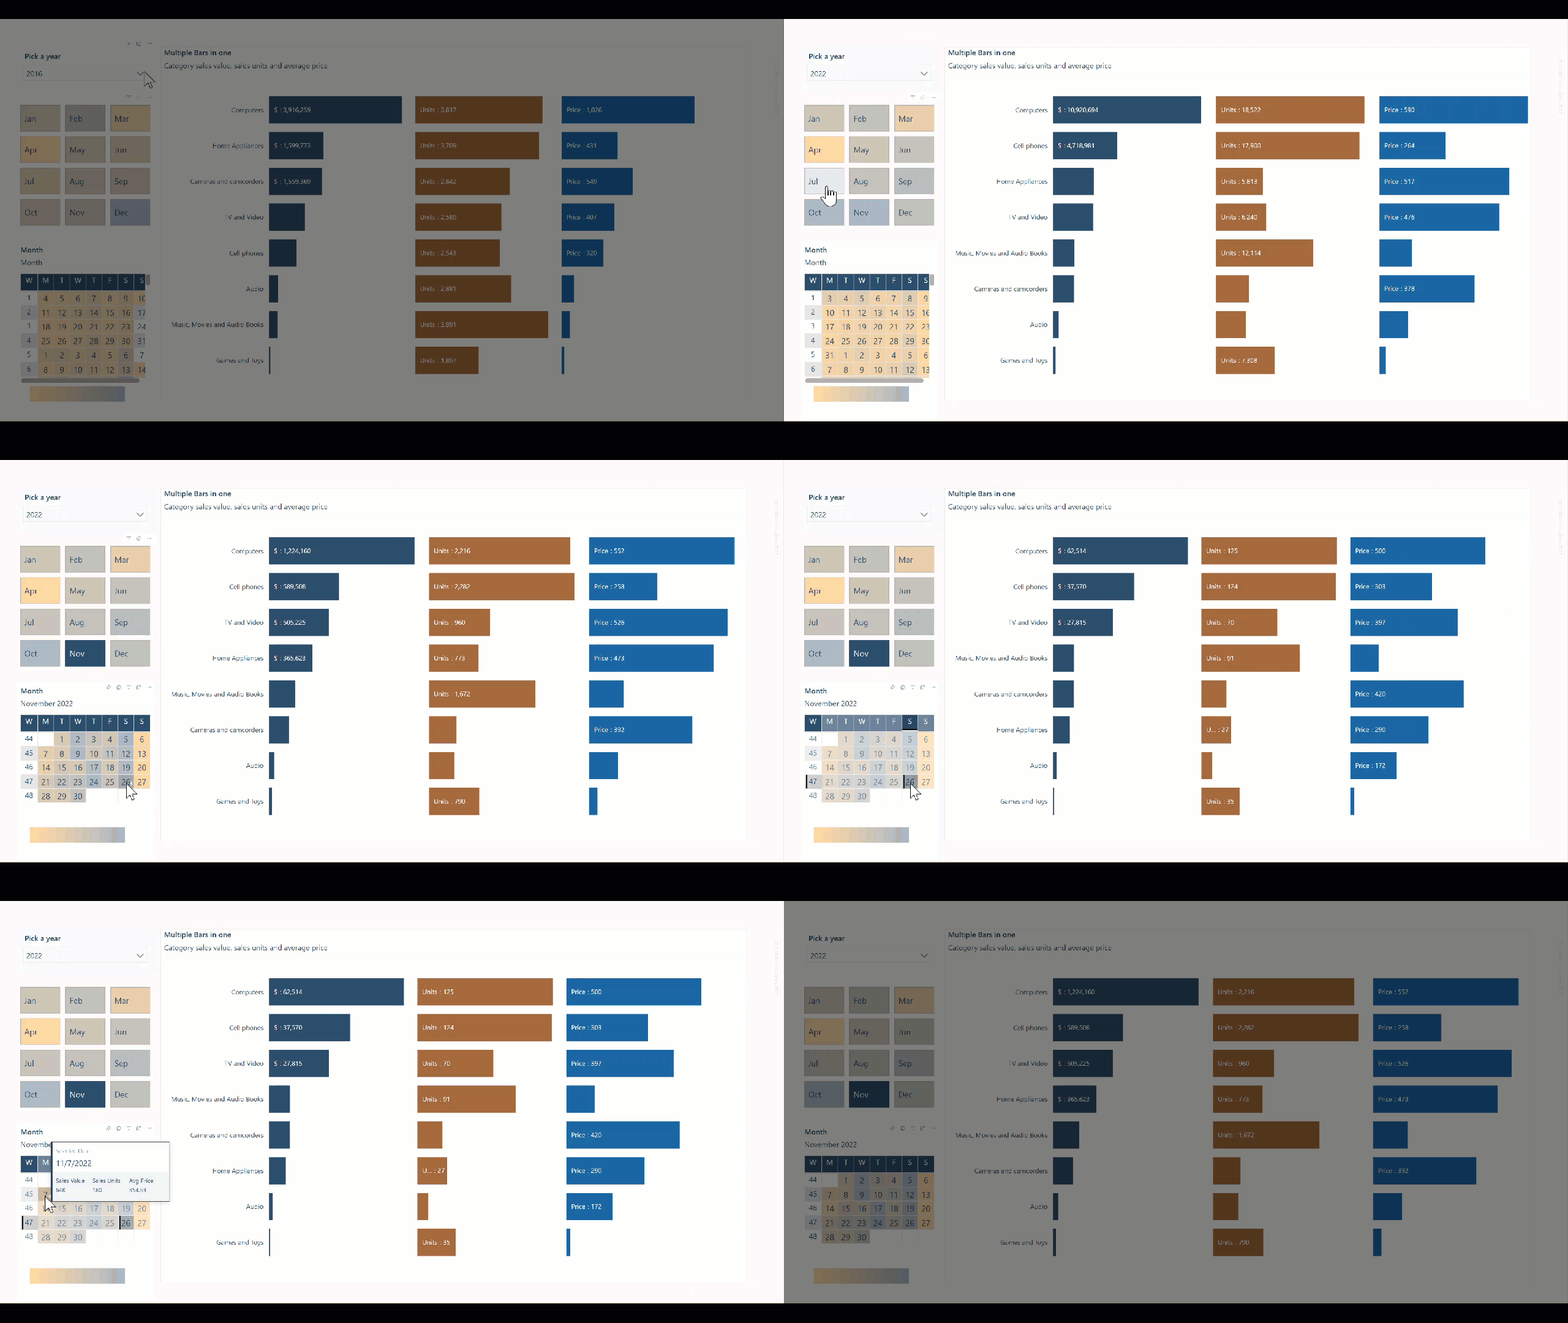
Erik generously posted his solution on GitHub, and that’s what we’re using today as our inspiration. Join us to build a Power BI report that uses the new slicer visual to select the month, and a matrix visual to select the day. The report also uses visual calculations to display the data – a real hat trick!

View Erik’s interactive report in Power BI.
Requirements
- Open the starter file and explore Erik’s data model.
The point of this week’s exercise is to create a calendar or date picker that serves as a filter. You can start with a simple table or bar chart as the main visual and build out your filters. After that, you can use a stacked bar chart and visual calcs to create the very cool multi-bar chart.
After adding your main visual (either a table or a bar chart), add your slicers:
- Add a dropdown slicer containing the Year value – adjust the slicer header text to make it user friendly.
- Add a new slicer visual, also called a tile slicer, to serve as the month slicer. Use the data field Month Short from the date table and be sure to turn on single select. You’ll need to adjust the formatting of the buttons – you can do this after you add your calendar.
- Add a matrix visual to build out the calendar (date picker) that enables users to select a day of the month.
- Notice that this calendar contains both the week # and the days of the week – very cool!
- Add a title and subtitle – conditionally format the subtitle
- Conditionally format the background color of the calendar based on sales value
- Ensure that all visuals meet the minimum standards of having alt text, that the tab order in your report makes sense, and that your color choices meet the minimum contrast standards.
Dataset
This week’s challenge uses a starter file rather than bringing data into Power BI desktop. Download the starter file.
Share
After you finish your workout, share on social media using the hashtags #WOW2024 and #PowerBI. On Twitter, tag @MMarie, @shan_gsd, @KerryKolosko.
Also make sure to fill out the Submission Tracker so that we can count you as a participant this week in order to track our participation throughout the year.
Solution
Download this week’s solution file from Erik’s GitHub repo.