2021 Week 46 | Power BI: Create a Color Contrast Calculator
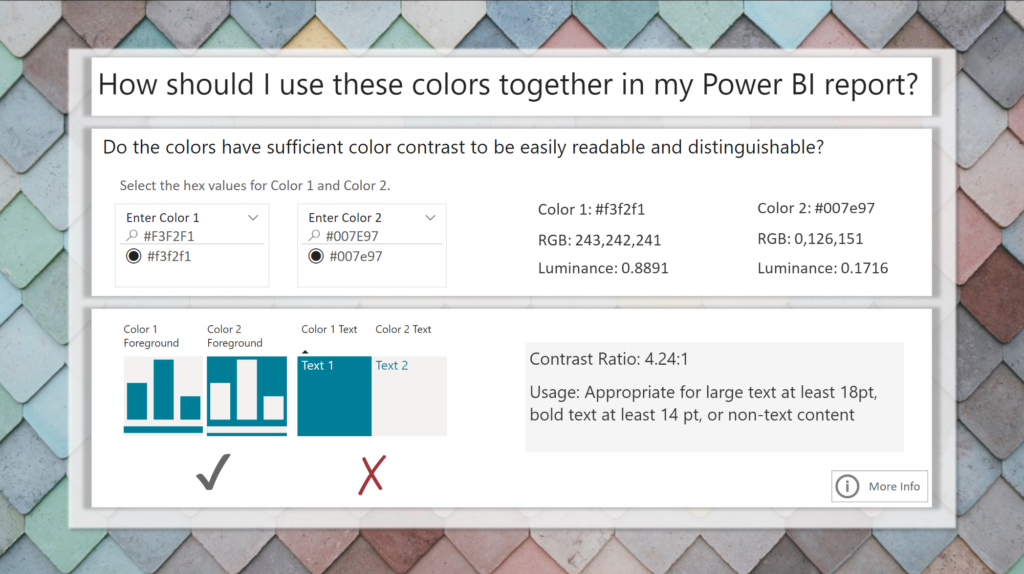
Introduction This week we are continuing our design theme by making a report about report design. Color is a very important element in report design. Color contrast is not only important for accessibility, it’s also an element of visual hierarchy. You can also use color contrast as a way to make elements on your report …
2021 Week 46 | Power BI: Create a Color Contrast Calculator Read More