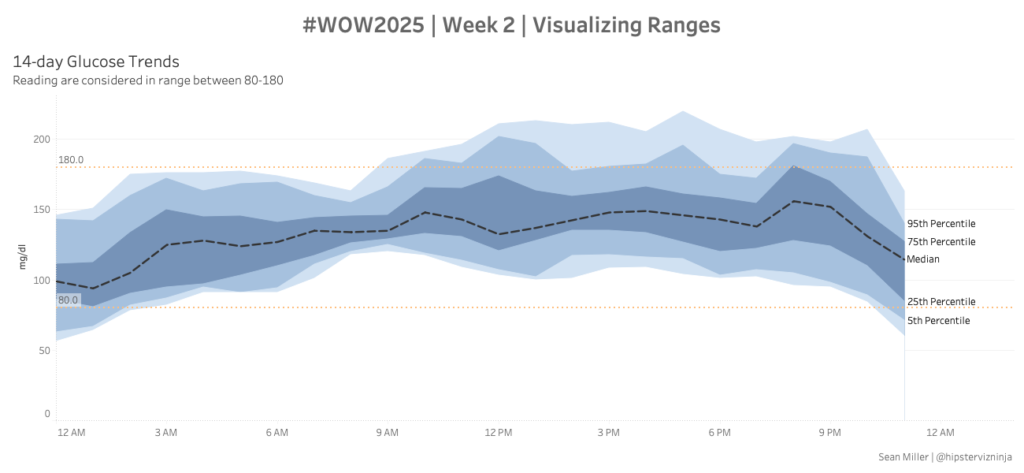
#WOW2025 | Week 2 | Visualizing Ranges
Introduction One of things that I really enjoy about using Tableau is finding interesting charts “in the wild” and attempting to replicate them. Last month, I saw a Power BI WOW challenge from Meagan that looked really interesting and I wanted to try it out. So here go! Can you visualize ranges? Click to open …


