Introduction
Not everyone wants to consume analytics through their desktop these days. We live in a busy world where people are often on the go, so we’re focussing on a mobile dashboard this week. The goal is to create a simple view that can be quickly glanced at to see our KPIs vs. last year’s period.
Requirements
- Upload the modified superstore dataset that can be found here. This contains data for 2023.
- Build a mobile dashboard that will fit the width of a smartphone
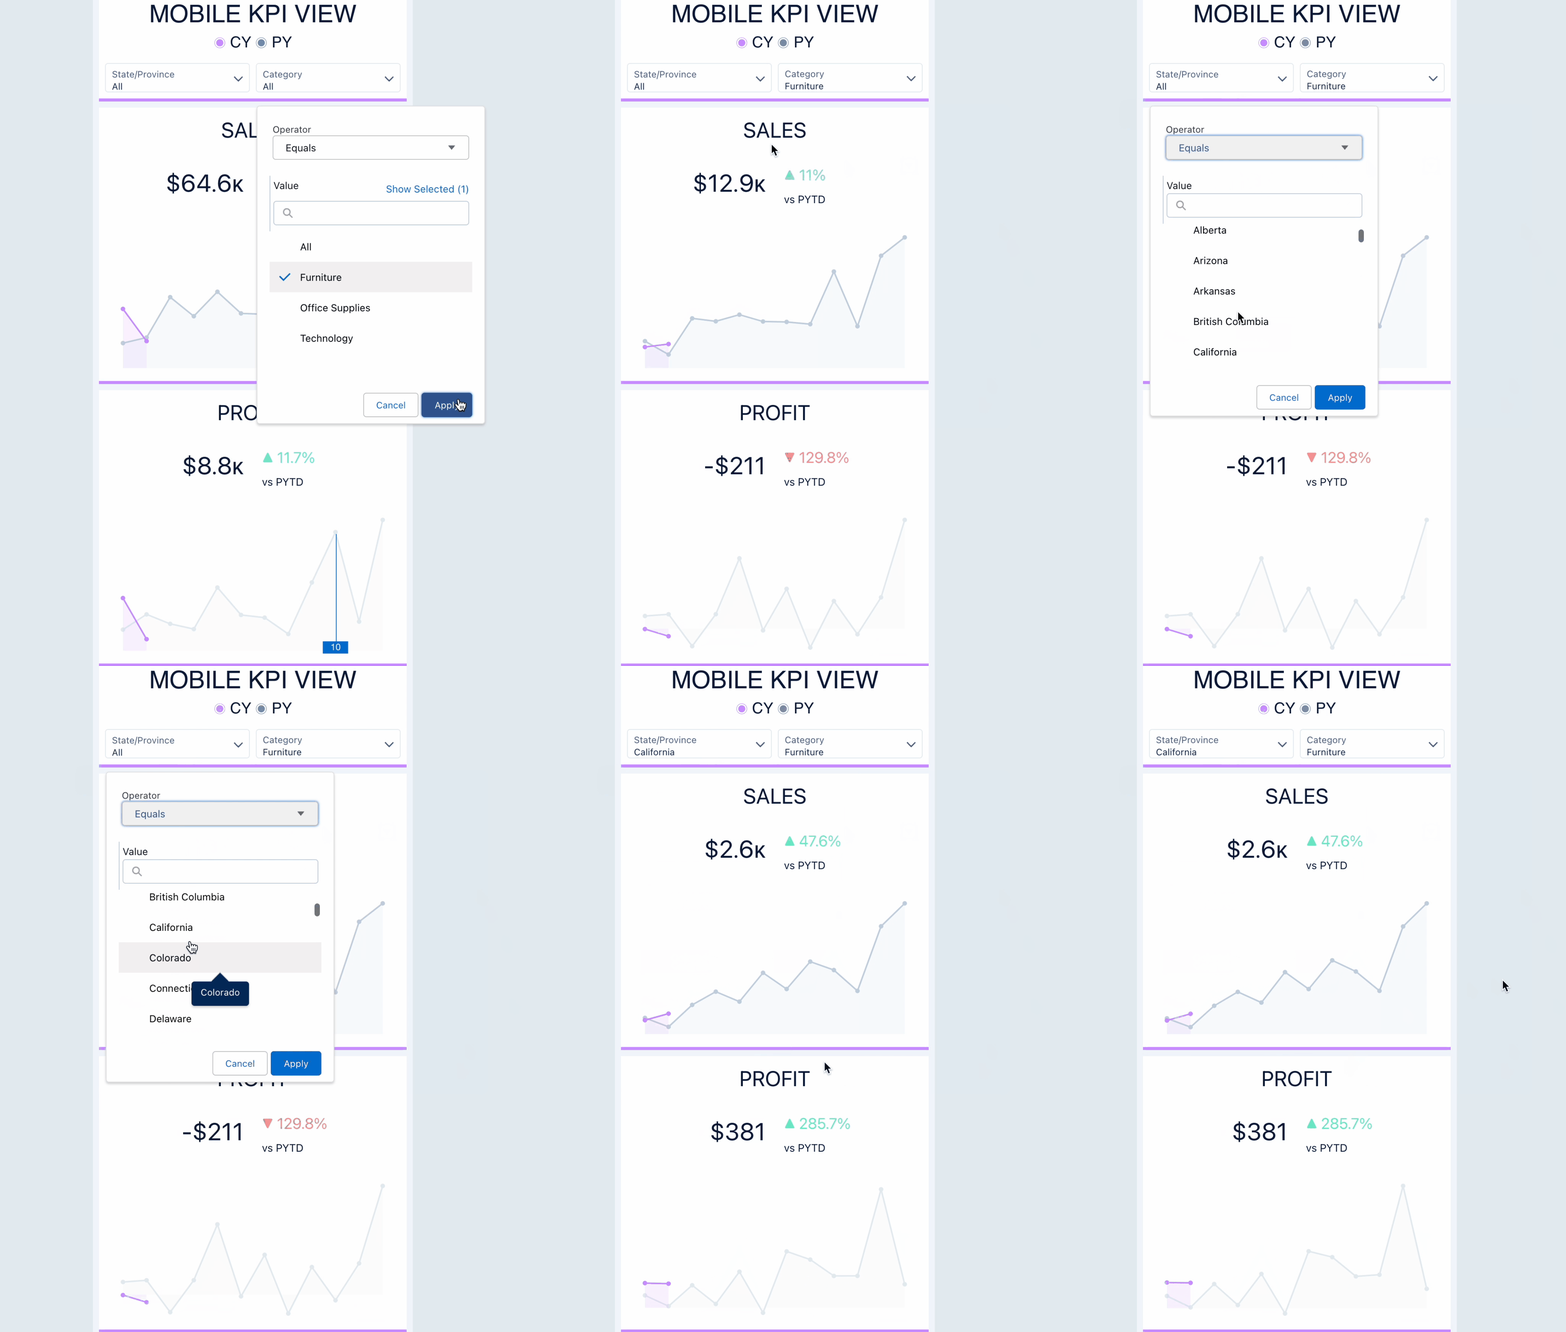
- Create two scorecards, one for Sales and one for Profit.
- Each scorecard should show sparklines for this year (YTD) and last year
- Each scorecard should also include some contextual numbers, one will be the value for this year, and the other will be the % change for the same period last year.
- Match custom and conditional formatting for these numbers (conditional formatting doesn’t seem to show up when viewing on a mobile device)
- Match all other dashboard formatting
- Include filters for state and category
- BONUS add additional scorecards for other metrics
The resulting dashboard should look like this. I have included both a desktop recording as the mobile view wasn’t showing conditional formatting.

Tips…
Dataset
This week uses a modified superstore dataset to include data from 2023. You can download it from this link: https://data.world/jackparry/wow-w9-superstore/workspace/file?filename=WoW+Week+9.csv
Share
After you finish your workout, share a screenshot of your solutions or interesting insights on Twitter or LinkedIn using the hashtags #WOW2023 and #CRMA and tag @genetis, @PreenzJ, @LaGMills and @JaackParry. (Or you can use this handy link to do that)
Also make sure to fill out the Submission Tracker to track your progress and help us judge the difficulty of our challenges.
Solution
Coming later…


