This week’s challenge was inspired by a question from a client. In truth, I was not able to solve the problem for them upfront.
This challenge would not exist were it not for an article in the Tableau Community that explains how to achieve the desired outcome – thanks to whoever wrote this up!
As a result, I’ve includes a Hints page. The first hint doesn’t reveal too much, but might help you figure things out on your own. The second hint is the original article that I used.
In this exercise, only use cities from the State of Ohio (or choose your own State, if you prefer)
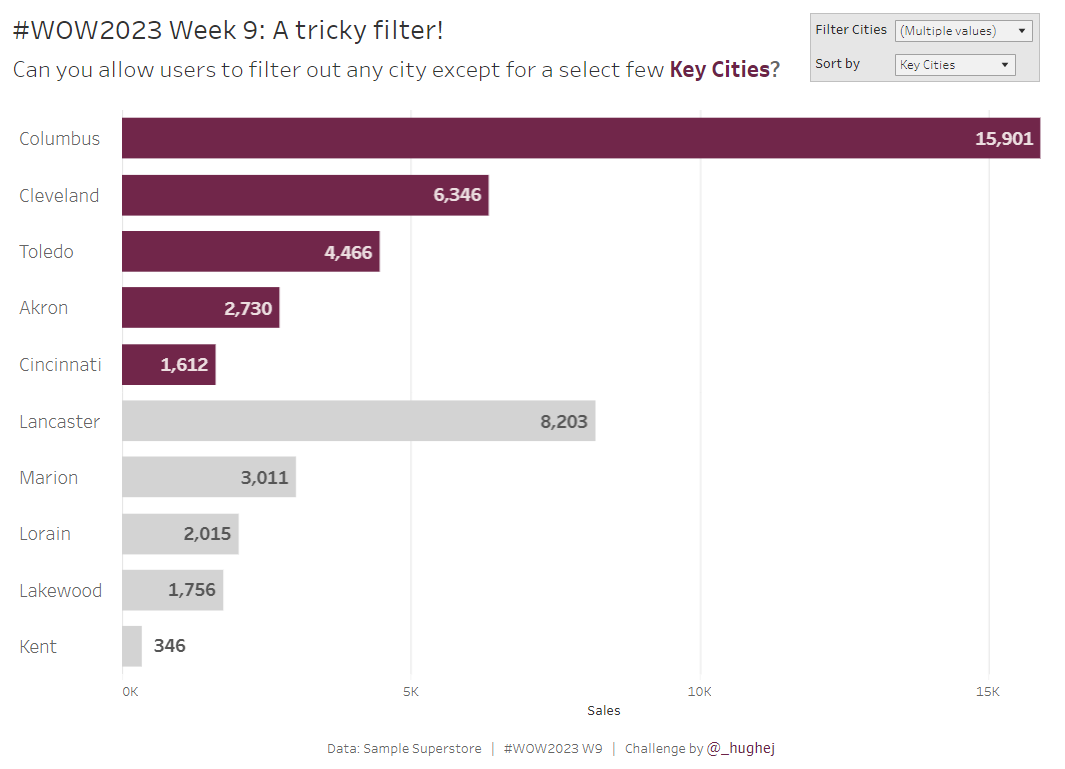
Create a Set that includes 5 “Key Cities”. I used Columbus, Cleveland, Toledo, Akron and Cincinnati (as these are the largest cities in Ohio, by population). NOTE: Remember that some city names appear in multiple states in the US.
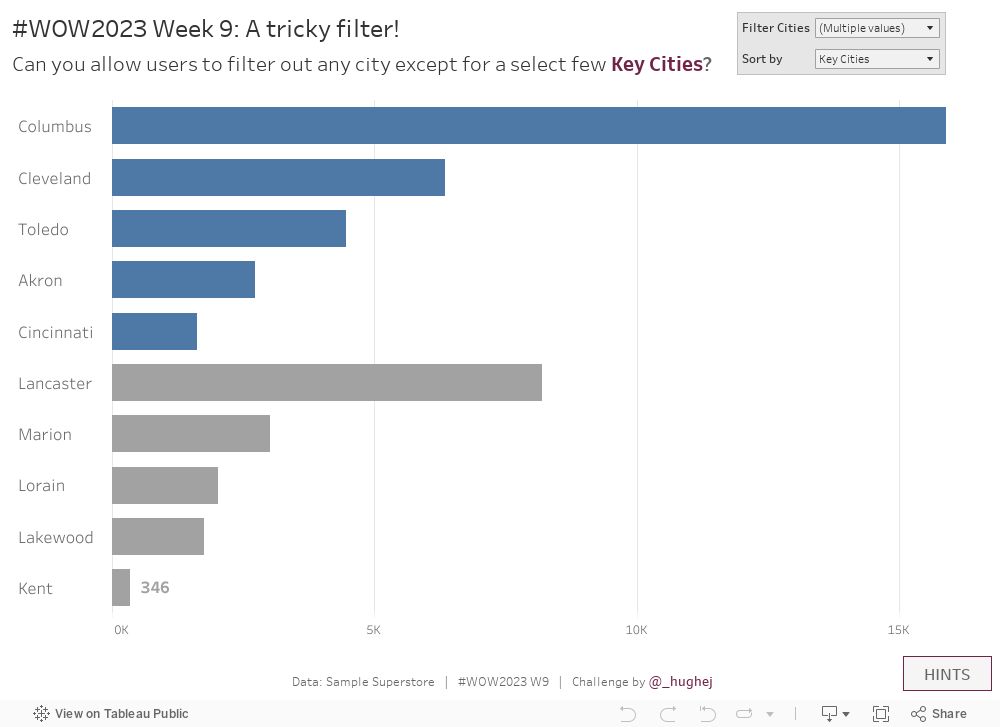
Colour the “Key Cities” with a highlight colour (I used #76264a) and the rest in grey
No tooltips!
Now the hard part…
Give users the ability to filter out any city EXCEPT the “Key Cities”. (Notice that the “Key Cities” do not appear in the filter menu)
Bonus:
Give the user the ability to sort by “Key City” vs other, or sort by Sales
Dataset
This week uses Sample Superstore data (v 2022.4). You can find it here on Data.World
Attribute
When you publish your solution on Tableau Public make sure to take the time and include a link to the original inspiration. Also include the hashtag #WOW2023 in your description to make it searchable!