Introduction
EDITOR’S NOTE: This challenge was originally published on Emma Whyte’s Tableau blog which no longer exists. The challenge is republished here with the author’s permissions
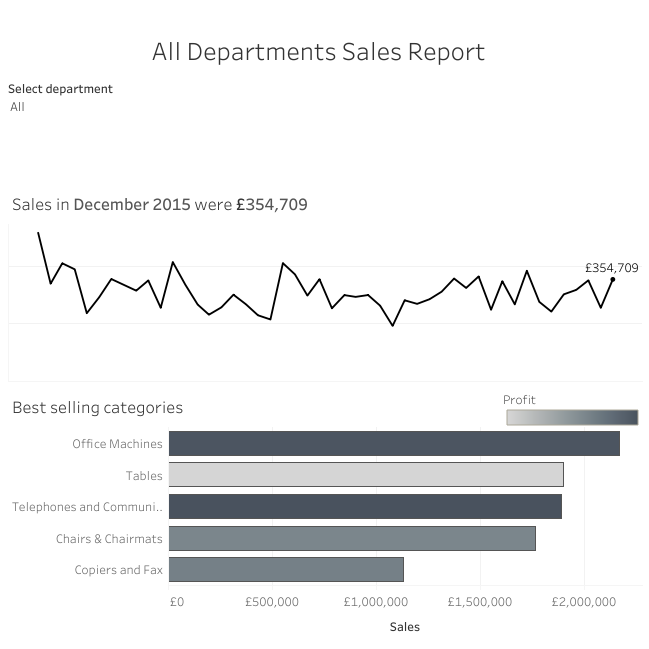
For week 2, I challenge you to recreate the dashboard below. The visualisations themselves are fairly simple. It’s the kick-ass text titles and logo switching that are the real challenge. Creating informative titles are an important part of data viz, so if you’re not familiar with these techniques already you’re going to learn something really useful too. We’re using Superstore data again (get the data here). The workbook is downloadable, but don’t cheat. Give it a real go before you download it to see if you got it right.
Requirements
- The dashboard title should change to say ‘All Departments’ when you select ‘All’ in the filter
- The department logo should change when you select a department, but disappear when you select ‘All’
- The line chart title should update when you change the filter
- All the charts and tooltips should look the same as mine
Dataset
This week uses an adapted Superstore data set. You can find it here on Data.World
Additional Files
You can get a copy of the logos from this drive location
Attribute
When you publish your solution on Tableau Public make sure to take the time and include a link to the original inspiration. Also include the hashtag #WOW2023 in your description to make it searchable!

Share
After you finish your workout, share on Twitter and/or LinkedIn using the hashtag #WOW2023 @Tableau and tag @WorkoutWednsday @EmmaWhyte & @vizwizbi
