One of the most intriguing aspects of being a Tableau developer is making sure you understand your stakeholders definitions of metrics. This challenge came out of a recent project I worked on where the metric definition from the stakeholder was different than my interpretation.
We are going to be analyzing new product sales – so what defines a product as new? That’s the $100k question! Your definition might be different than mine which might be different from the stakeholder.
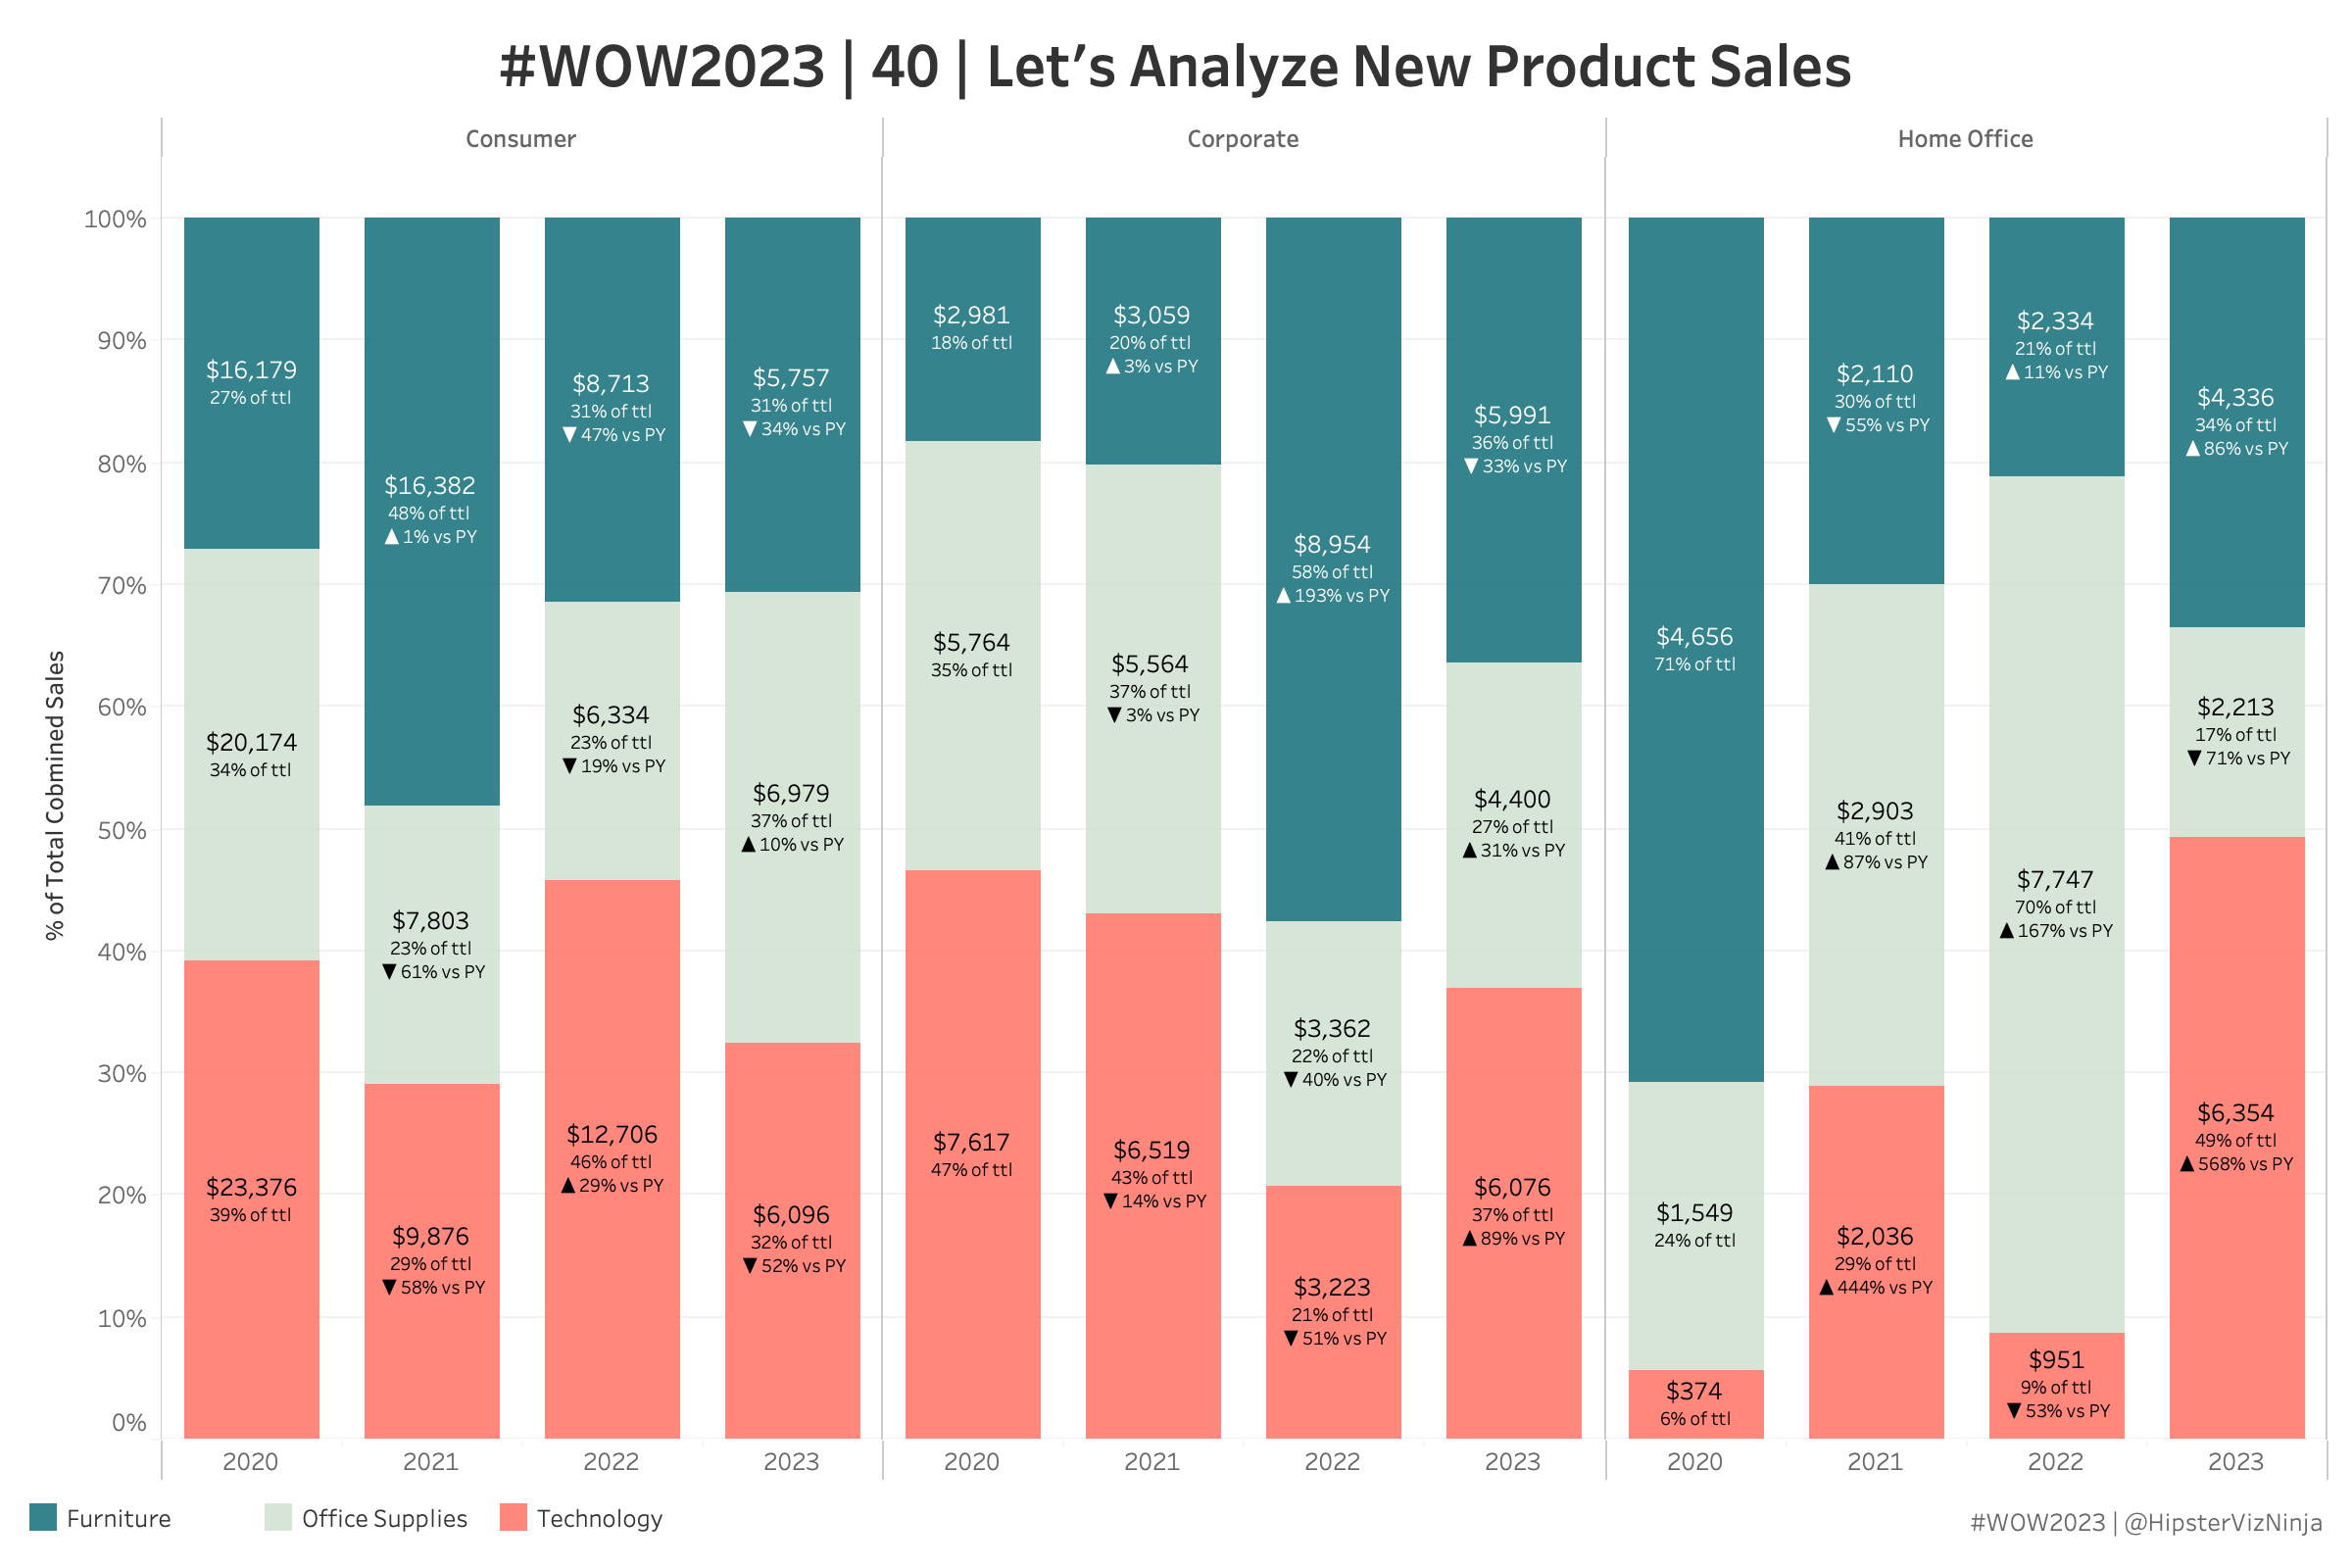
It’s a seemingly simple chart but there are tricks around every corner 🙂 Enjoy!
Create a stacked bar chart ofsales for new products using
previous month based on today
Sept for each previous year
Year & Segment
Category on color
#056571 – Furniture
#CCDFCB – Office Supplies
#FF6A5C – Technology
A NEW PRODUCT is defined as any product with no sales in the previous year for the same month.
If the current month is October, we need find products with no sales in September of the previous year(s).
There will be different products in each year
Dataset
This week uses Superstore data set. You can find it here on Data.World
Attribute
When you publish your solution on Tableau Public make sure to take the time and include a link to the original inspiration. Also include the hashtag #WOW2023 in your description to make it searchable!