
Requirements – Intermediate
- Format: 600px by 600px
- Create side-by-side bar chart that shows:
- profit ratio for the Home Office segment and category.
- Overall Profit ratio for all segments by category.
- Profit Ratio: sum(profit)/sum(sales)
- Add a label for the Overall bar and the Home Office bar
- Inside the Home Office bar show the percent difference between Home Office and Overall — ([Home Office] – [Overall])/[Overall]
- Make sure a footer of the categories shows up at the bottom of the dashboard.
- Color choices are up to you.
- Follow all intermediate requirements.
- Create bars so there is more space between categories.
- No annotations allowed
- SUPER DUPER WAYYYYYYY ADVANCED OPTIONAL: Do not use Measure Names or Measure Values. Do not use table calculations.
Challenge – Advanced

Click image to view on Tableau Public
Requirements
Dataset
This week uses the superstore dataset for Tableau 2019.1. You can get it here at data.worldShare
After you finish your workout, share on Twitter using the hashtag #WorkoutWednesday2019 and tag @AnnUJackson, @LukeStanke, @lorna_eden, and @curtisharris_!
Track your progress
Also, don’t forget to track your progress using this Workout Wednesday form.
Attribute
When you publish your solution on Tableau Public make sure to take the time and include a link to the original inspiration.

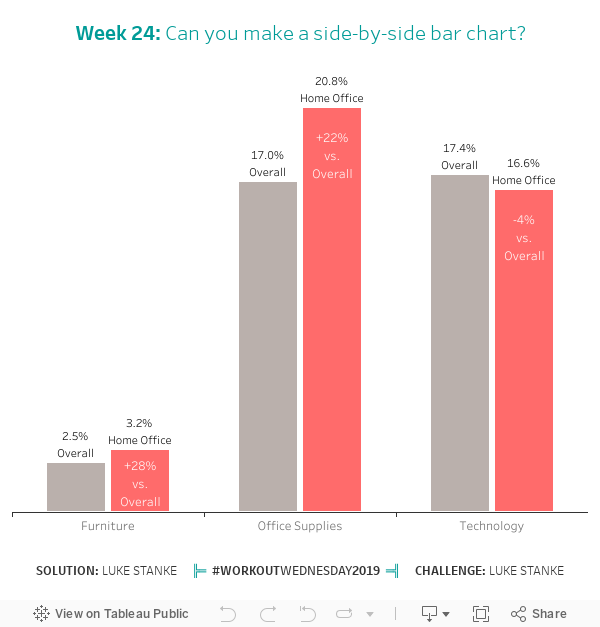
This week you need to build this side-by-side bar chart. There are a couple of tricks but you should be able to do this in under 30 minutes (for real!). There are at least 4 ways to solve this problem. There are also two problems an intermediate and an advanced.
Challenge – Intermediate

Click image to view on Tableau Public
Requirements – Intermediate
Challenge – Advanced
Click image to view on Tableau Public
Requirements
Dataset
This week uses the superstore dataset for Tableau 2019.1. You can get it here at data.worldShare
After you finish your workout, share on Twitter using the hashtag #WorkoutWednesday2019 and tag @AnnUJackson, @LukeStanke, @lorna_eden, and @curtisharris_!
Track your progress
Also, don’t forget to track your progress using this Workout Wednesday form.
Attribute
When you publish your solution on Tableau Public make sure to take the time and include a link to the original inspiration.
pippo