Year: 2021

2021 Week 10 | Tableau: Can you build a must include filter?

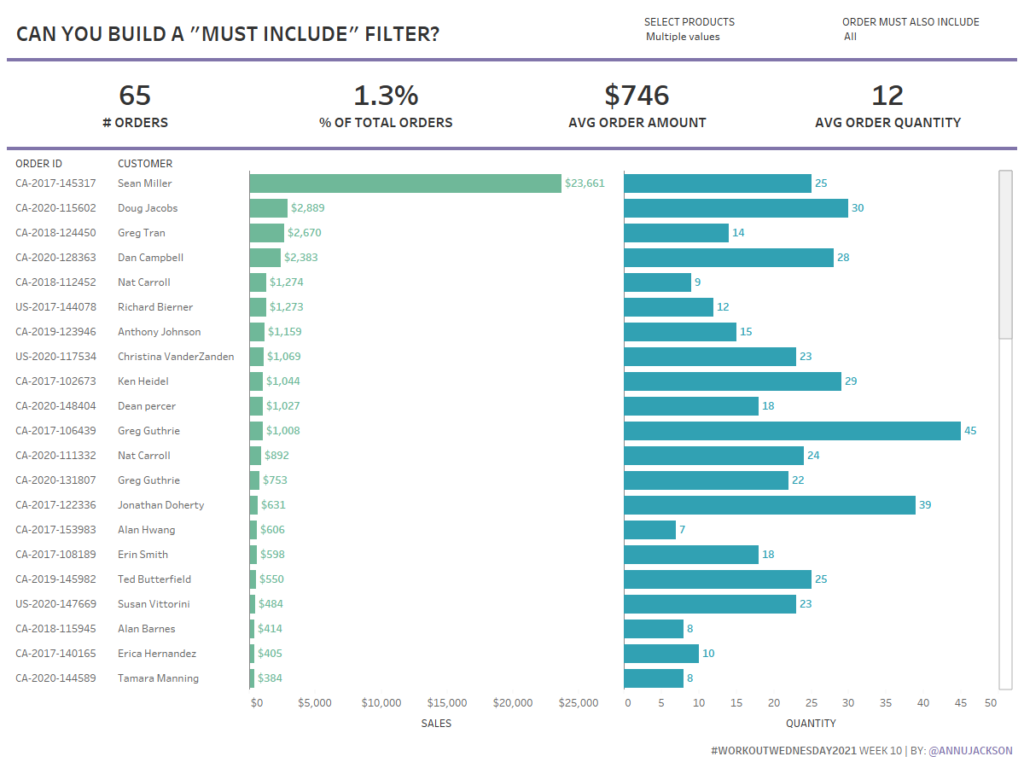
Introduction This week’s challenge is pulled directly from a work challenge I encountered recently.  The ask was to build a filtering system that would allow the user to initially filter data and then add a secondary requirement of inclusion. Using the Superstore data set, the functionality we wanted to achieve was: Allow user to filter …

2021 Week 10 | Tableau: Can you build a must include filter? Read More

2021 Week 10 | Power BI: Violin Plot Custom Visual

Introduction Thanks for joining us for Week 10 of Workout Wednesday – Power BI Edition.  This week our challenge is to use the Violin Plot custom visual. There are no dependencies on prior weeks for this workout, so feel free to jump right in.  Custom visuals are additional visuals created by Microsoft and Microsoft partners …

2021 Week 10 | Power BI: Violin Plot Custom Visual Read More

2021 Week 9 | Power BI: Forecasting and Anomaly Detection

Introduction Welcome back for Week 9 of Workout Wednesday, Power BI edition. If you’re joining us for the first time, welcome! You can jump right in this week, where we’ll be exploring our data in Power BI.  For this week’s challenge are going to use anomaly detection and forecasting to gain a deeper understanding of what’s going on now …

2021 Week 9 | Power BI: Forecasting and Anomaly Detection Read More

2021 Week 9: Can You Hide A Chart in the Map Layers?

Introduction So, I’m a little late for Mardi Gras – but that didn’t stop me from thinking about King Cake, a New Orleans tradition (with French roots) where a little plastic baby is put inside of a cake that is plastered with green, yellow, and purple frosting with tons of sprinkles. Anyone teeth hurt yet? …

2021 Week 9: Can You Hide A Chart in the Map Layers? Read More

2021 Week 8 | Power BI: SWITCH()ing Measures

Introduction Thanks to everyone who has ben participating in #WorkoutWednesday – Power BI edition. This week we are going to be diving into switching metrics in your reports using SWITCH() and a slicer. This method can be especially useful when designing reports for mobile use. Toggling between metrics allows you to save real estate on …

2021 Week 8 | Power BI: SWITCH()ing Measures Read More

2020 Week 7 | Tableau : Can you use Dashboard Extensions?

Introduction Features and functionality on using Tableau and Tableau Public are ever growing. I believe we as WOW have never done this particular object before. Did you know that Tableau has an Extension Gallery? But also did you know that some of the extensions work on Tableau Public?  I never thought about using Extensions on …

2020 Week 7 | Tableau : Can you use Dashboard Extensions? Read More

2021 Week 6 | Tableau: Can you build a Fancy Text Table?

Introduction This month I’ve decided to focus on something you’ve rarely ever seen from me – a good old fashioned text table.  This challenge should be straightforward for users of all levels. And of course since I try to avoid plain text tables, this one has some fancy formatting thrown in for good measure. There …

2021 Week 6 | Tableau: Can you build a Fancy Text Table? Read More

Scroll to Top