Introduction
Features and functionality on using Tableau and Tableau Public are ever growing. I believe we as WOW have never done this particular object before. Did you know that Tableau has an Extension Gallery? But also did you know that some of the extensions work on Tableau Public?
I never thought about using Extensions on Tableau public before. But here is your chance. Coming soon with 2021.1 there will also be more Tableau Public available extensions
Requirements
- Dashboard Size: 1200px by 600 px
- # of Sheets – 3 Max
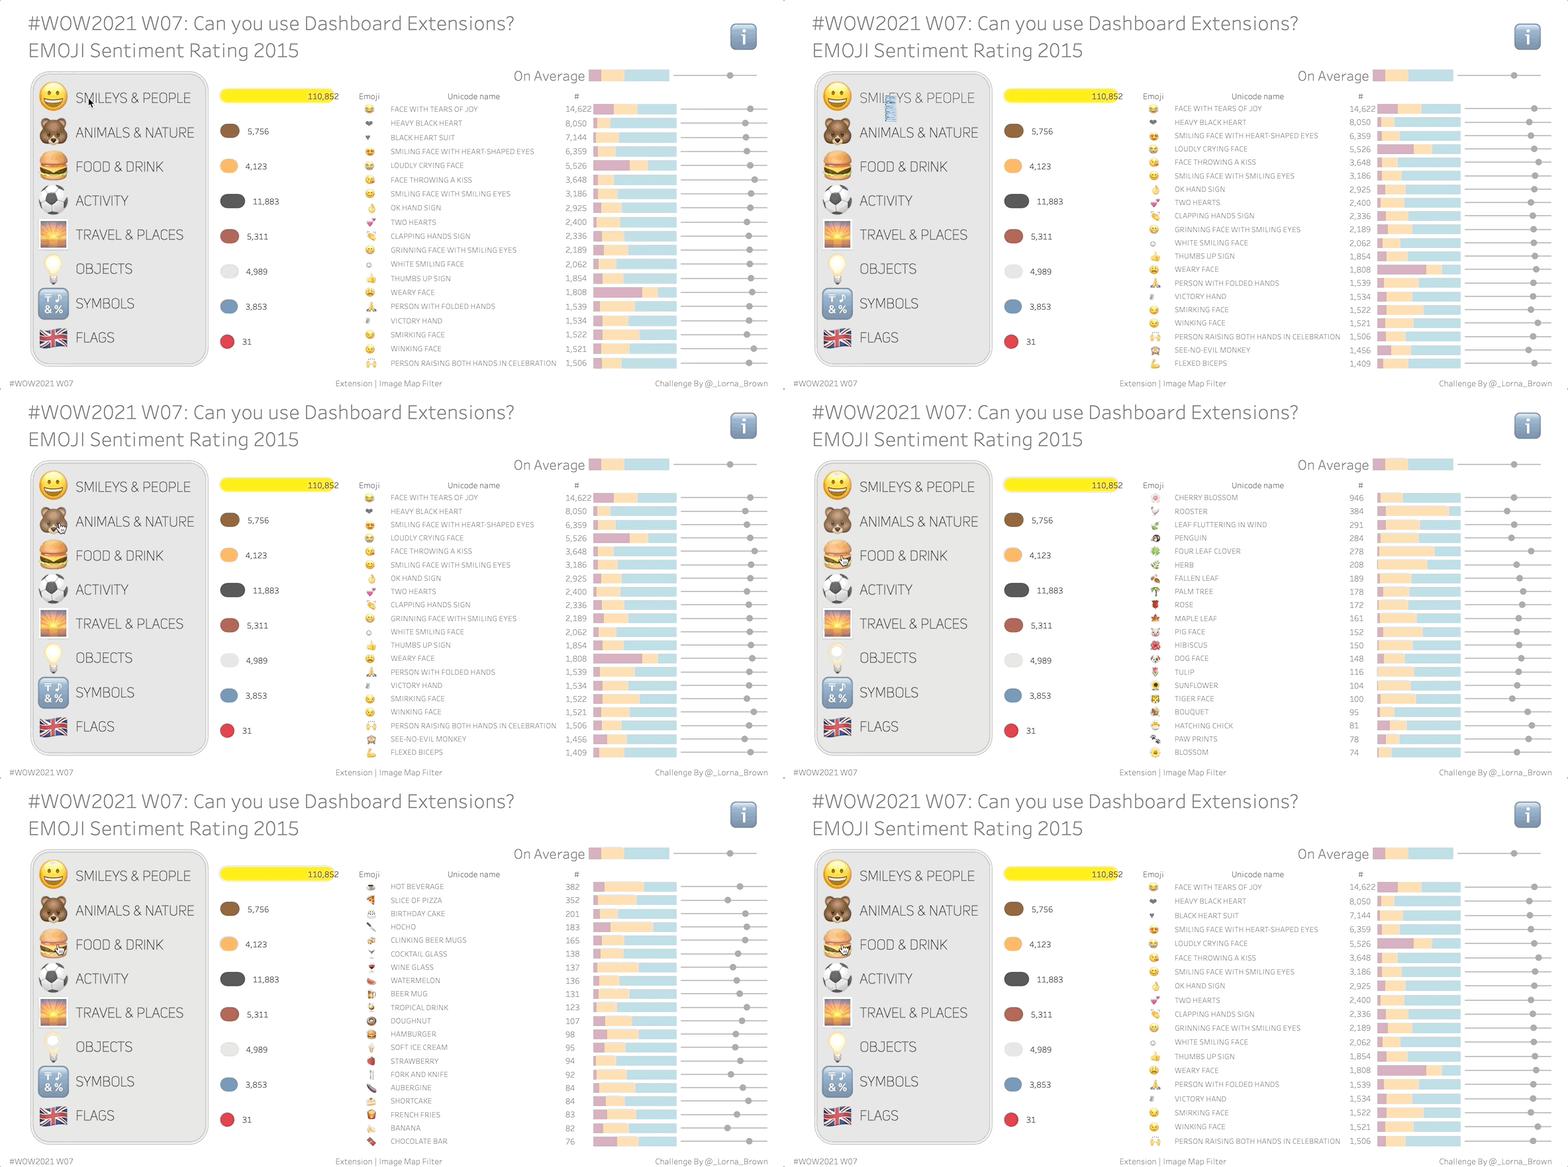
- Use the top 20 emojis based on number of tweets
- Create the % of positive, neutral and negative tweets stacked bar
- Show average position of emoji in tweet
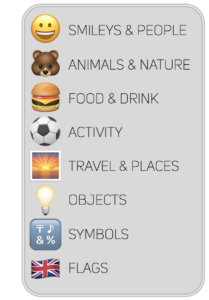
- Use the Image Map Extension to filter to groups of emojis (you will need to download this file)
- Create the link between the extension and the emoji view
- Match Formatting and Colours
Dataset & Resources
This week is using two data sets Emoji Sentiment & Emoji Database. Linkable by code points (will need a relationship calculation). The inspiration was taken from here
Finally you will need the image for the image map (or create your own)

Attribute
When you publish your solution on Tableau Public make sure to take the time and include a link to the original inspiration. Also include the hashtag #WOW2021 in your description to make it searchable!

Share
After you finish your workout, share on Twitter using the hashtag #WOW2021 and tag @AnnUJackson, @ItsCandraM, @LukeStanke, @_Lorna_Brown and @HipsterVizNinja


Hello,
Could you provide the link which you have used for sheet 1
Hello Team,
Could you include the sheet 1 file used as the kaggle file is not displaying all the groups.