
Introduction
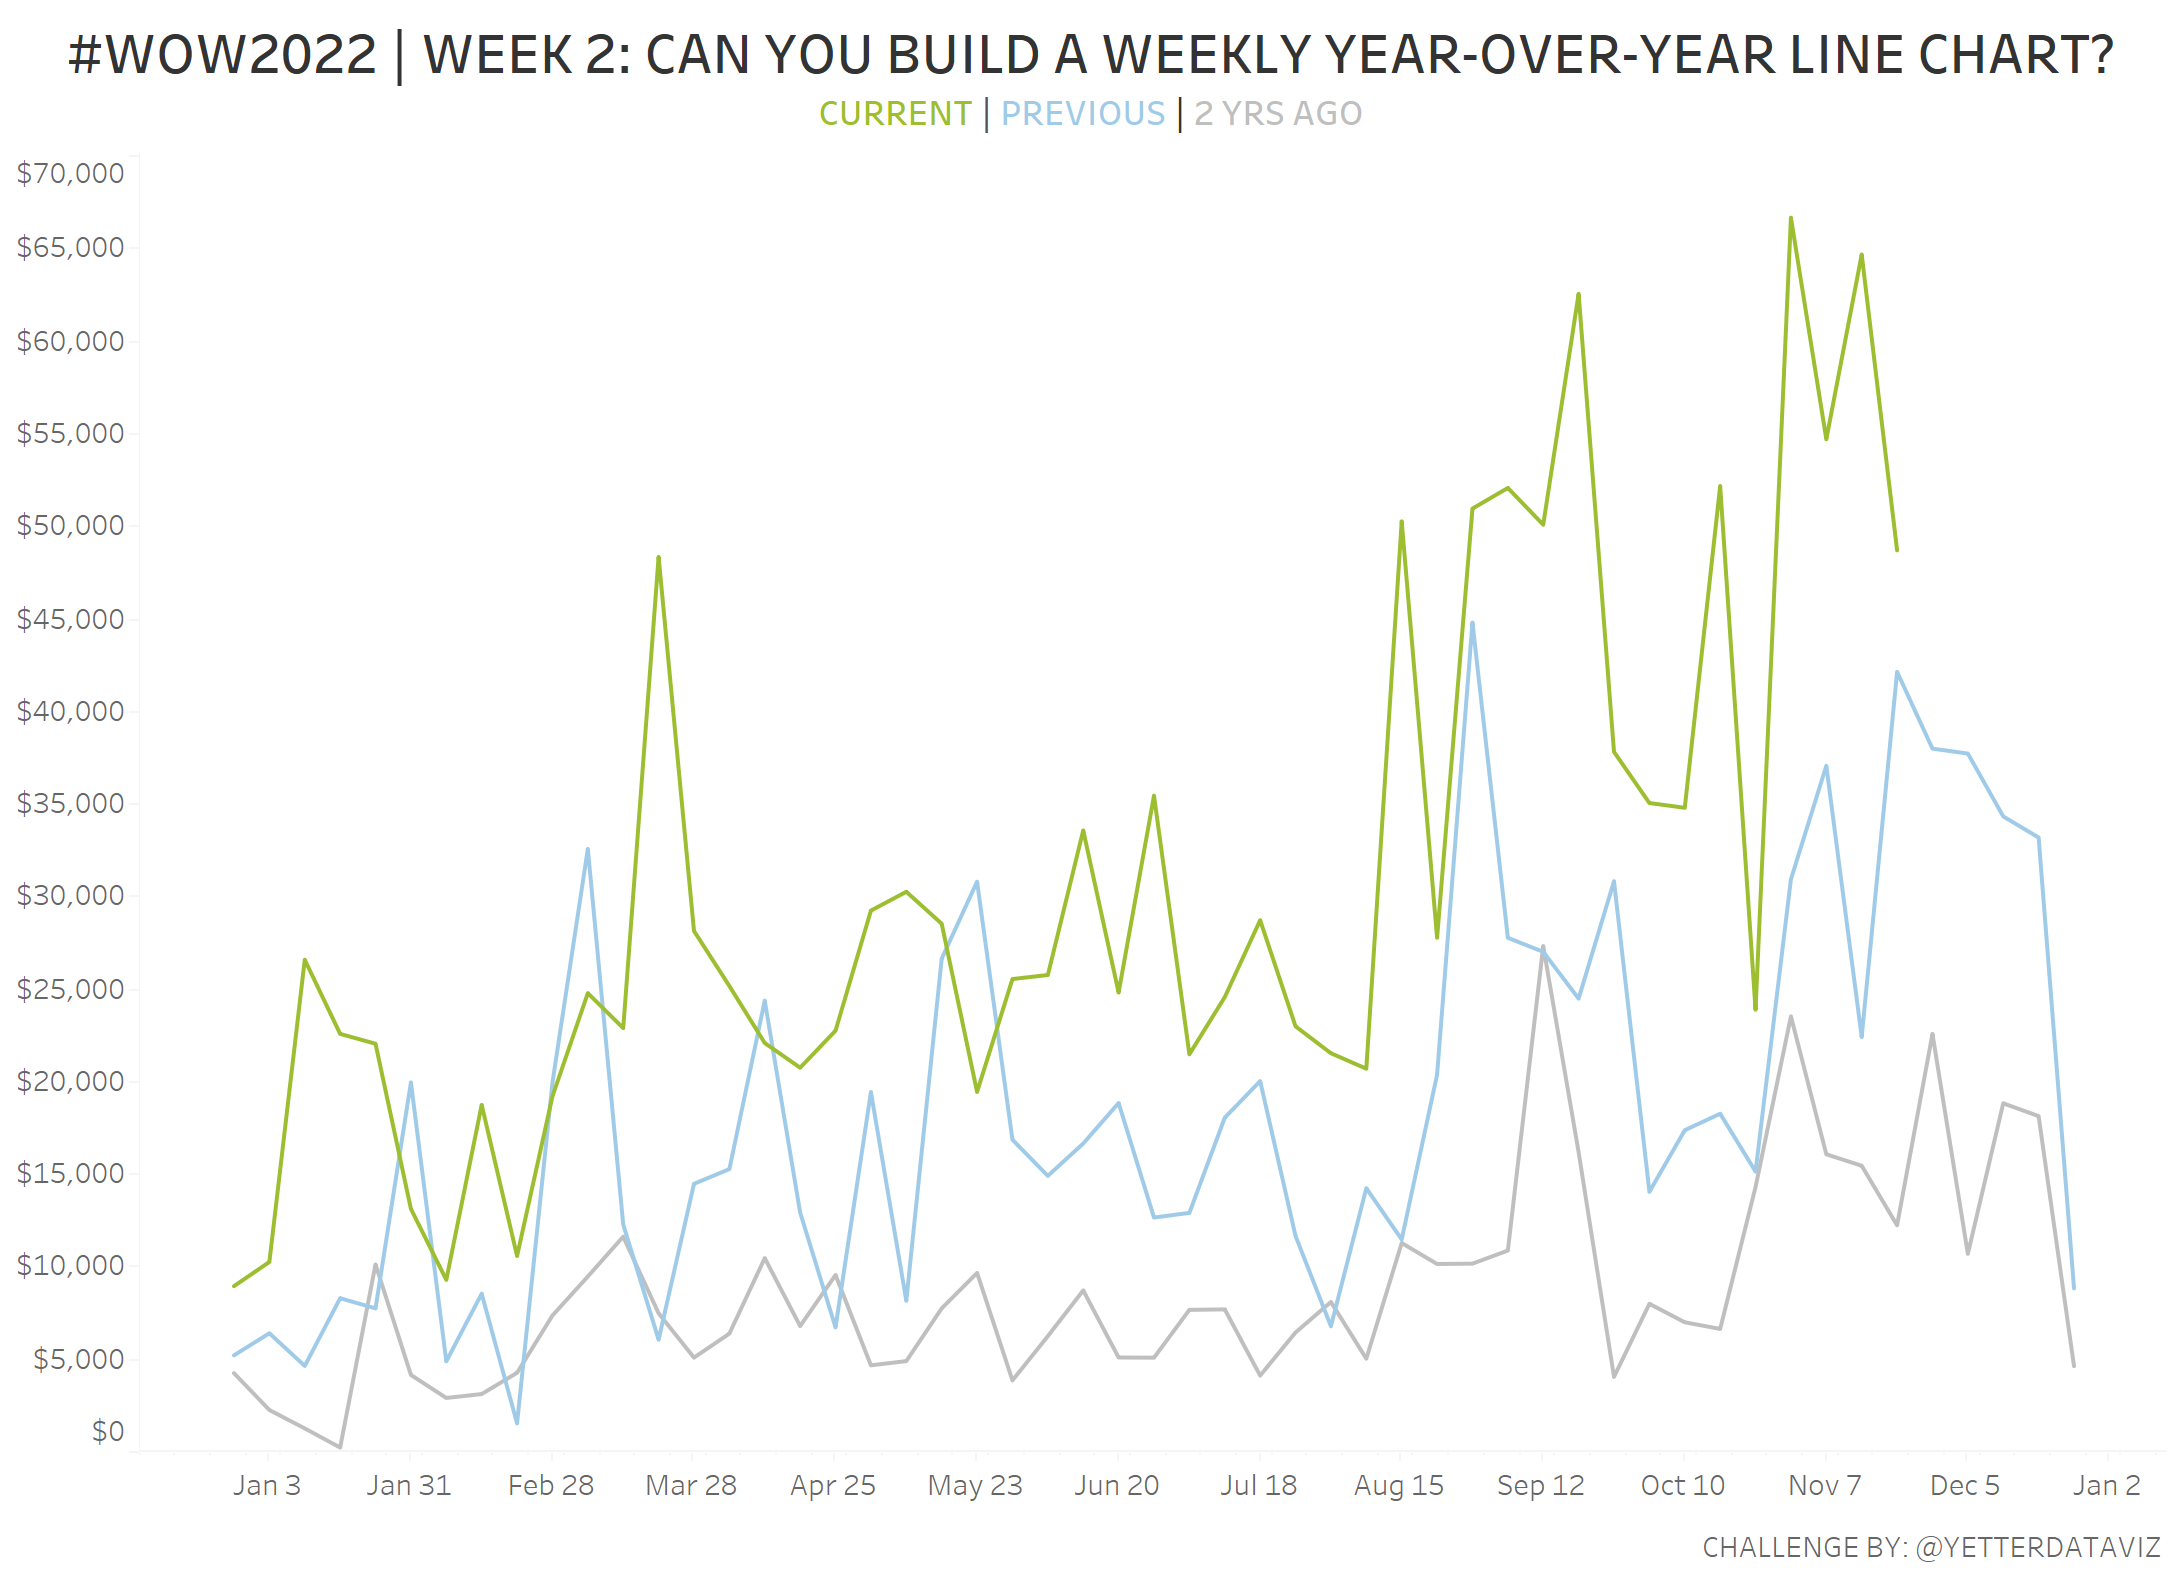
I’m excited to join the Workout Wednesday coaching team this year! For my first challenge, I’m pulling from some recent work experience. Our leadership team wanted to see weekly performance for the week ending Sunday, with the current and prior 2 years in the chart. We also needed to include the YoY% change, and the proper week ending date depending on the year.
I’ve split this workout into the main challenge (~4 calcs) and a couple more advanced bonus items if you’re feeling up to it.
Requirements
- Dashboard Size: 1100px by 800 px
- Since the data only goes through 12/31/2021, you can use a parameter to set a fixed “Today” date of 12/1/2021
- Create a line chart showing weekly sales (Monday-Sunday) for each of the last 3 years
- Current (#9CBE30), Previous (#A0CBE8), and 2 Yrs Ago (#BFBFBF)
- Calculate the Year-over-Year percentage change by week
- Match formatting and tooltips (Hint: Pay attention to the YoY% label)
- Create a filter to exclude the incomplete week (“today” 12/1 is a Wednesday)
- BONUS – Advanced
- Calculate the “week ending” date, showing the correct Sunday date for a each week and year. (The first point of each line should be Jan 3 [Current], Jan 5 [Previous], Jan 6 [2 Yrs Ago])
- Format YoY% with positive (#9CBE30) or negative (#E15759) color in the tooltip
Dataset
This week uses an adjusted superstore dataset. You can get it here at data.world
Attribute
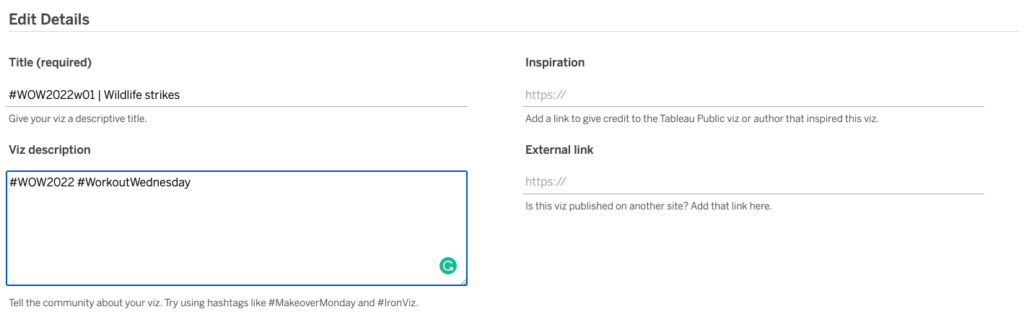
When you publish your solution on Tableau Public make sure to take the time and include a link to the original inspiration. Also include the hashtag #WOW2022 in your description to make it searchable!
Share
After you finish your workout, share on Twitter using the hashtag #WOW2022 and tag @LukeStanke, @_Lorna_Brown, @HipsterVizNinja, @_hughej, and @YetterDataViz