Introduction
This week is our third installment of this month’s “dashboard series” so we’ll be building upon Erica’s challenge from Week 5 and Sean’s challenge from Week 6. If you’ve done Week 6, you can start from that, or you can check out those challenges linked above and come back to this when you’re done…or you can grab a starting point here.
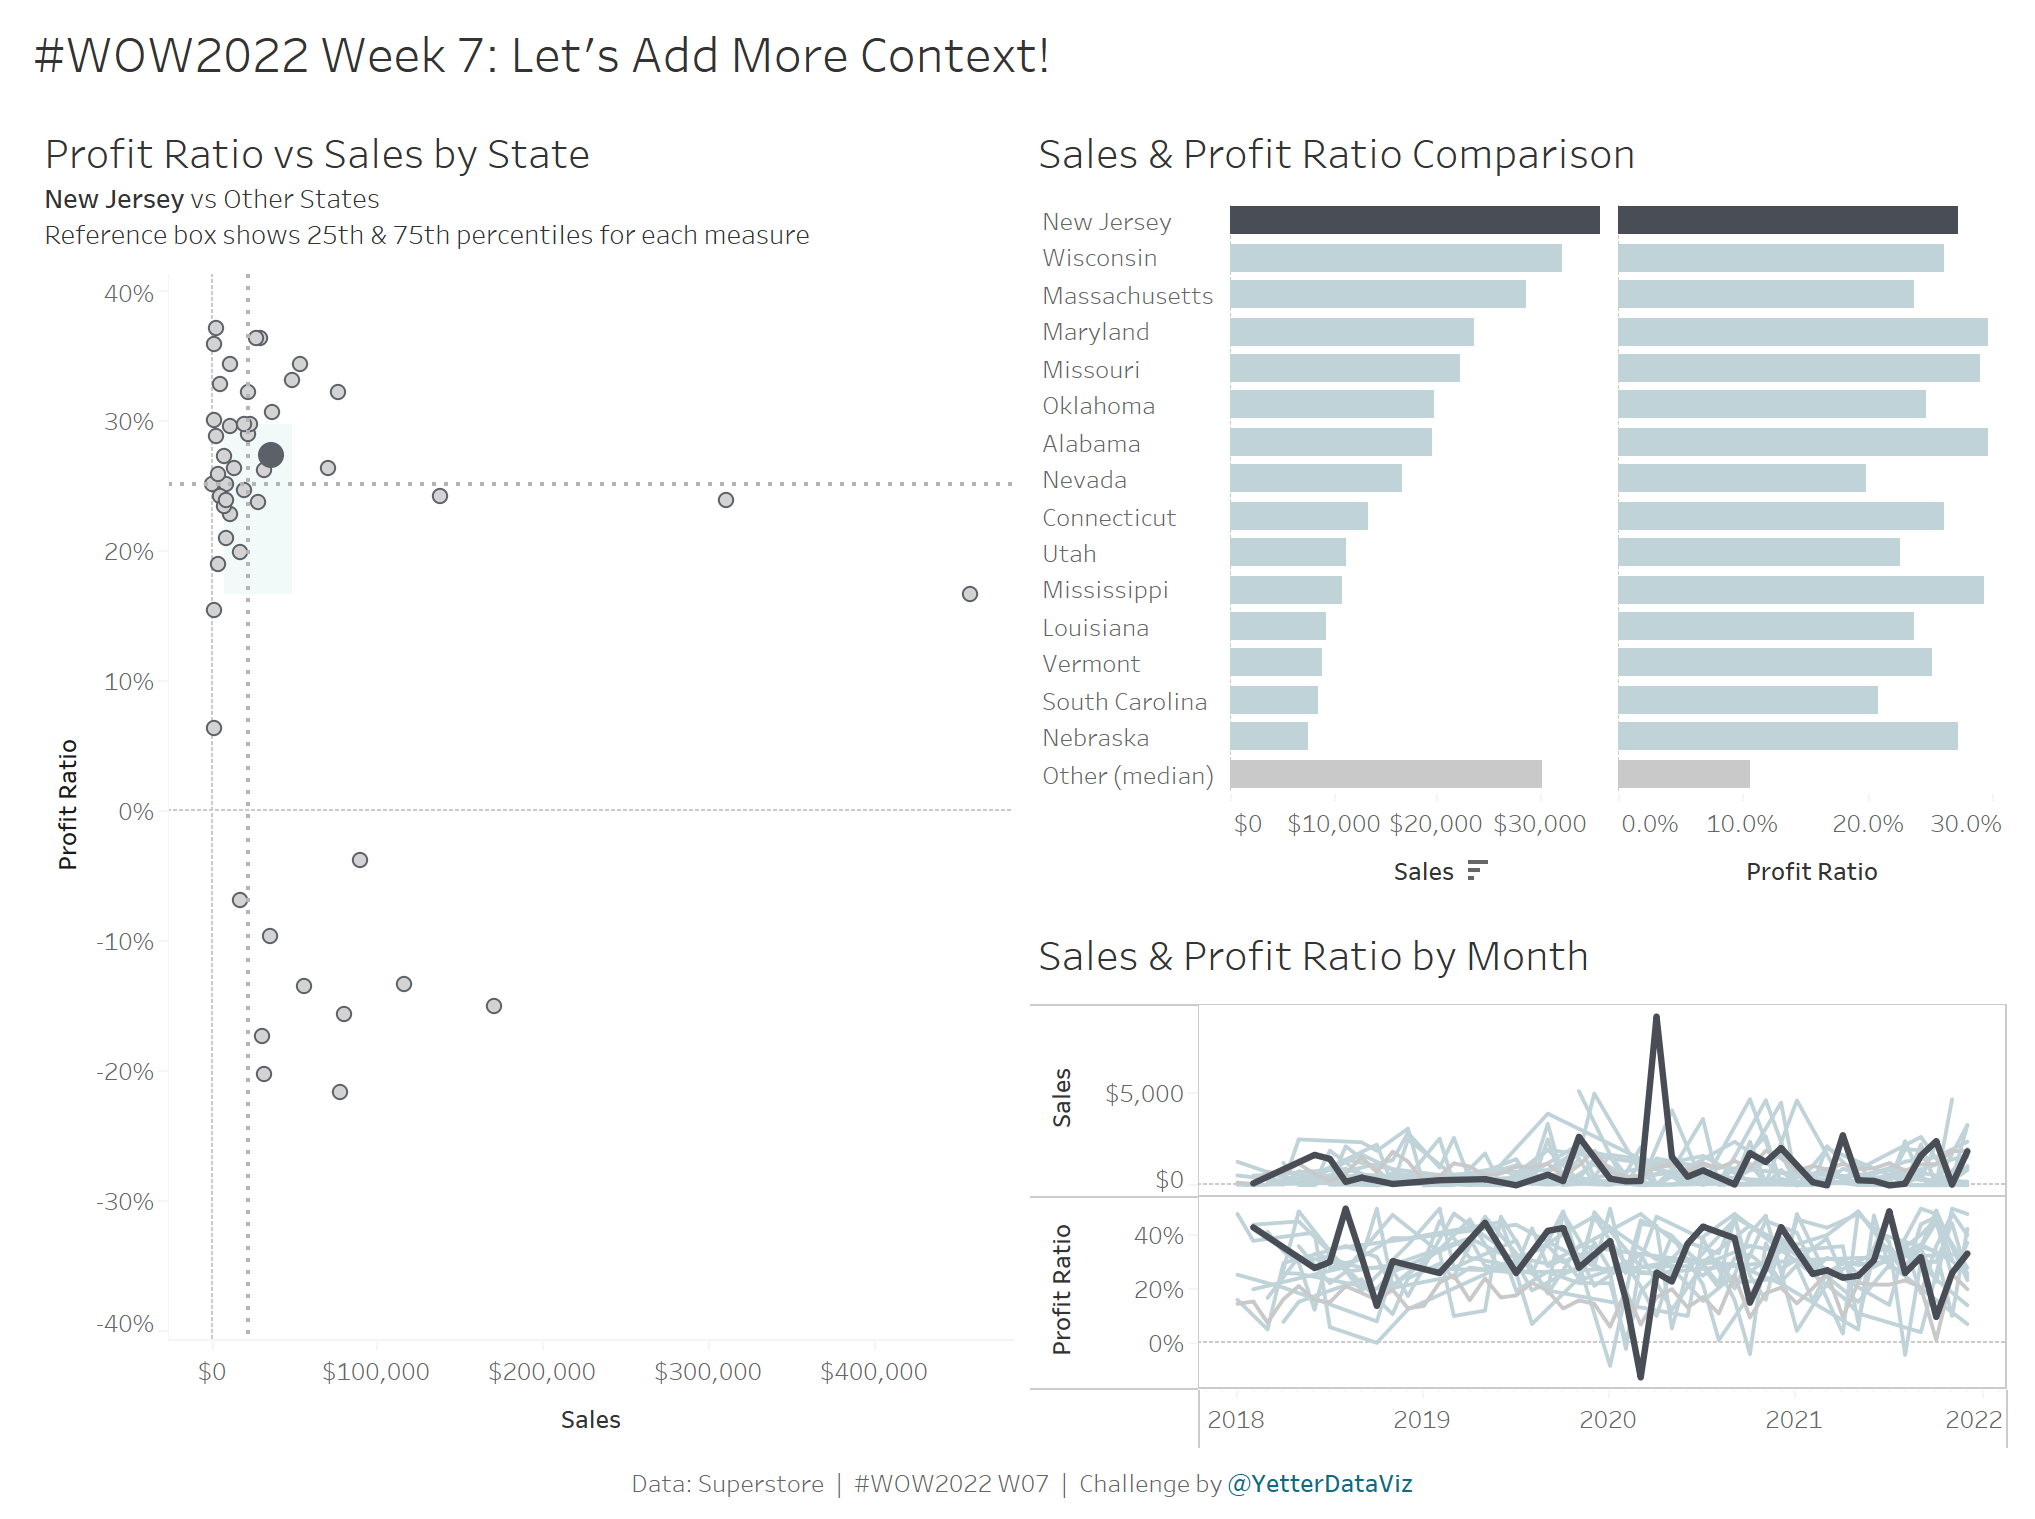
Sean’s challenge added some context to help with interpreting the scatterplot. One of the questions I get most often when showing a bar graph to a stakeholder is, “what does that look like over time? And how does it compare to others?” So we’re going to add a time series to the dashboard.
Requirements
- Dashboard Size: 1050 x 800px
- 3 sheets
- In addition to Week 5 Scatterplot and Week 6 Bar Graphs…
- Create a line chart that shows
- Sales and Profit Ratio by Month
- Selected States, Reference Box States, and one line for Outlier States (matching the bars with median)
- Selected State line should be thicker than others
- Add the line chart to the dashboard (preferably using containers…if you’ve never used containers, try them out! If you need some help, you can check out Tim’s or Curtis’ video tutorial.)
- When clicking on a bar, the corresponding line should be highlighted (including a thicker line)
- Match Tooltips/Formatting
Dataset
This week uses Superstore from 2021.4. You can find it here on Data.World
Attribute
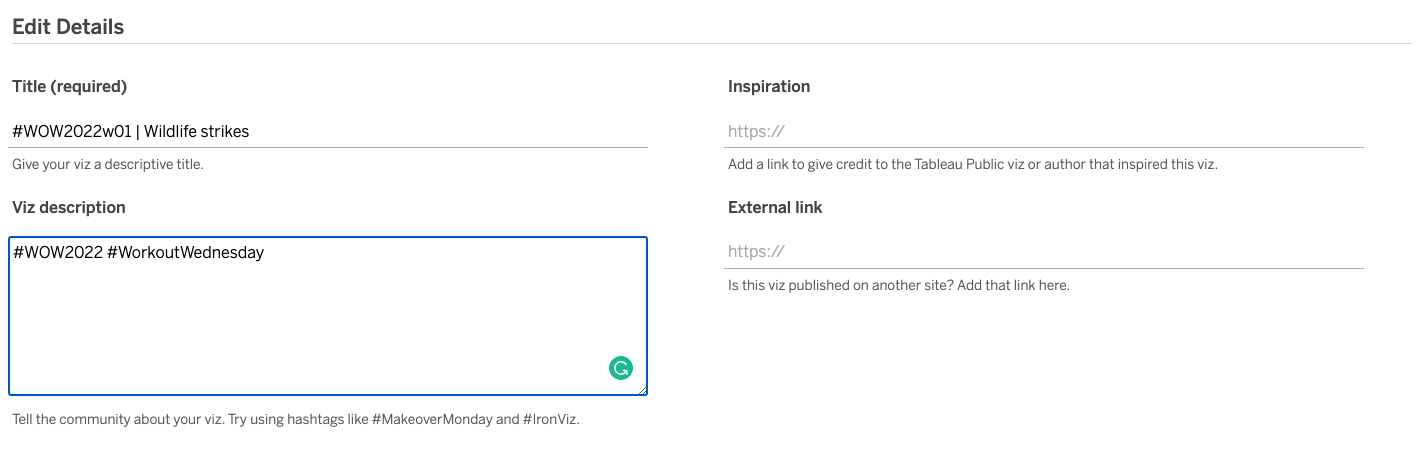
When you publish your solution on Tableau Public make sure to take the time and include a link to the original inspiration. Also include the hashtag #WOW2022 in your description to make it searchable!
Share
After you finish your workout, share on Twitter using the hashtag #WOW2022 and tag @LukeStanke, @_Lorna_Brown, @HipsterVizNinja, @_hughej, and @YetterDataViz