#WOW2022 | 21 | Let’s Build a Trellis Chart!

Introduction

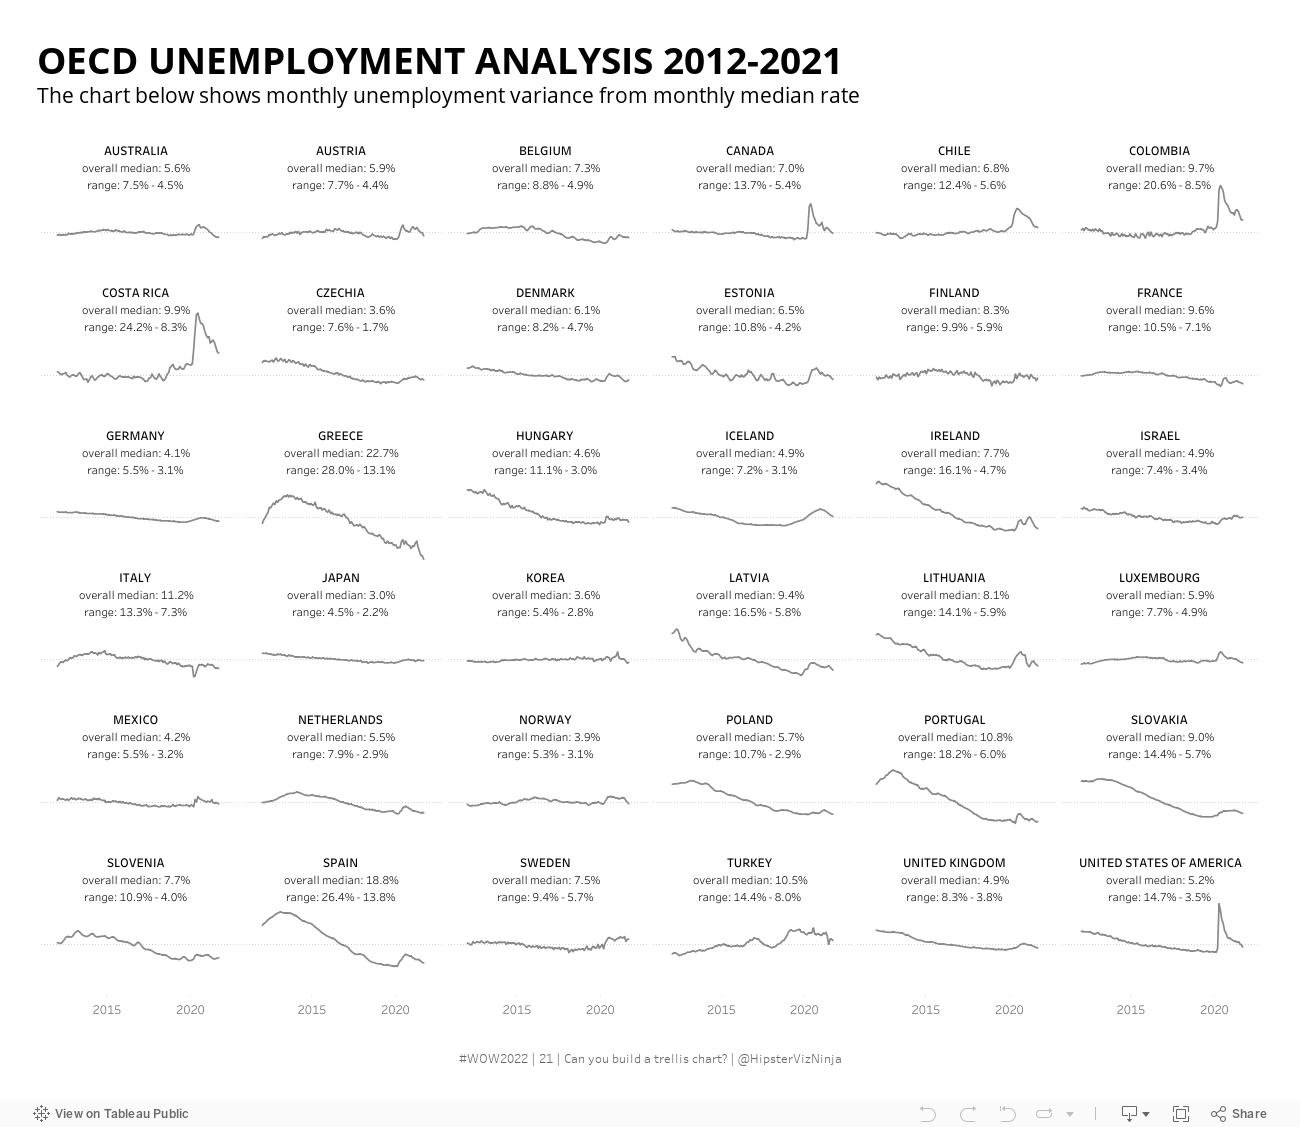
Fresh off the heels of #Data22, it’s already time for a new #WOW2022 Tableau challenge! One of my favorite charts is the small multiple. It can be used to show a lot of data in a compact view. Typically, small multiples are used to visualize a single measure with two discrete dimensions. And that’s pretty easy to do in Tableau, simply have one dimension on rows and the other on rows and you’re good to go. But what about when you have a single dimension that you want to you use? Well this is where things get tricky in Tableau.

There are a large number of solution blogs out there explaining multiple ways to create a trellis/panel chart like the one we’re going to build this week. I would encourage you to play around with a few solutions to see the similarities and differences. 

So with that, let’s get on with the challenge!

Requirements

  • Dashboard Size: 1300 x 1100px
  • 1 sheet
  • Create a trellis/panel chart showing the monthly variance compared to the overall monthly median value for each country
  • Filter the dataset to only 2012 and beyond
  • 🚨  NO LoDs!  🚨
  • Each country line should be labeled with:
    • Country Name
    • Overall monthly median
    • Overall monthly minimum
    • Overall monthly maximum
  • Match formatting
    • pay attention to the little details 😉
  • Match tooltips

Dataset

This week uses the Week 2 dataset from #Back2VizBasics. You can find it here on Data.World

Attribute

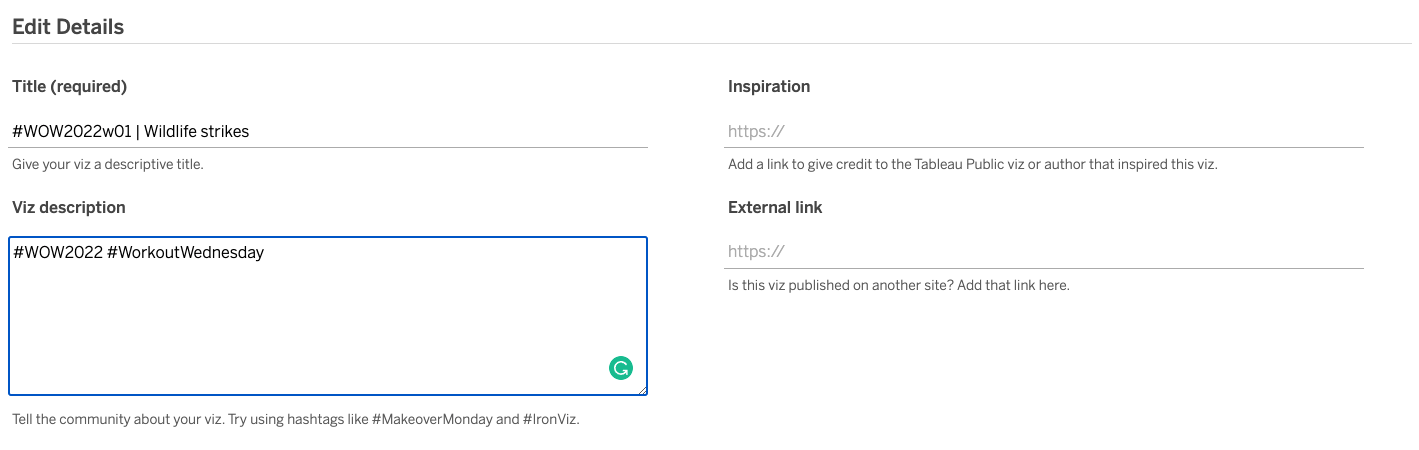
When you publish your solution on Tableau Public make sure to take the time and include a link to the original inspiration.  Also include the hashtag #WOW2022 in your description to make it searchable!

Share

After you finish your workout, share on Twitter using the hashtag #WOW2022 and tag @LukeStanke, @_Lorna_Brown, @HipsterVizNinja, @_hughej, and @YetterDataViz

Solution

Interactive

Leave a Comment

Your email address will not be published. Required fields are marked *

Scroll to Top