A few weeks ago I saw this Twitter poll (and the ensuing discussion) about Team Tiled vs Team Floating and I noted that I am neither. Rather, I am Team Container. Using Containers in dashboards makes positioning and sizing everything in your dashboard a piece of cake, once you have mastered how they work. Until then, they can be confusing. So, here’s another opportunity to practice with containers! (And some actions as well!)
If you finish this and want some additional container practice, check out some previous challenges here.
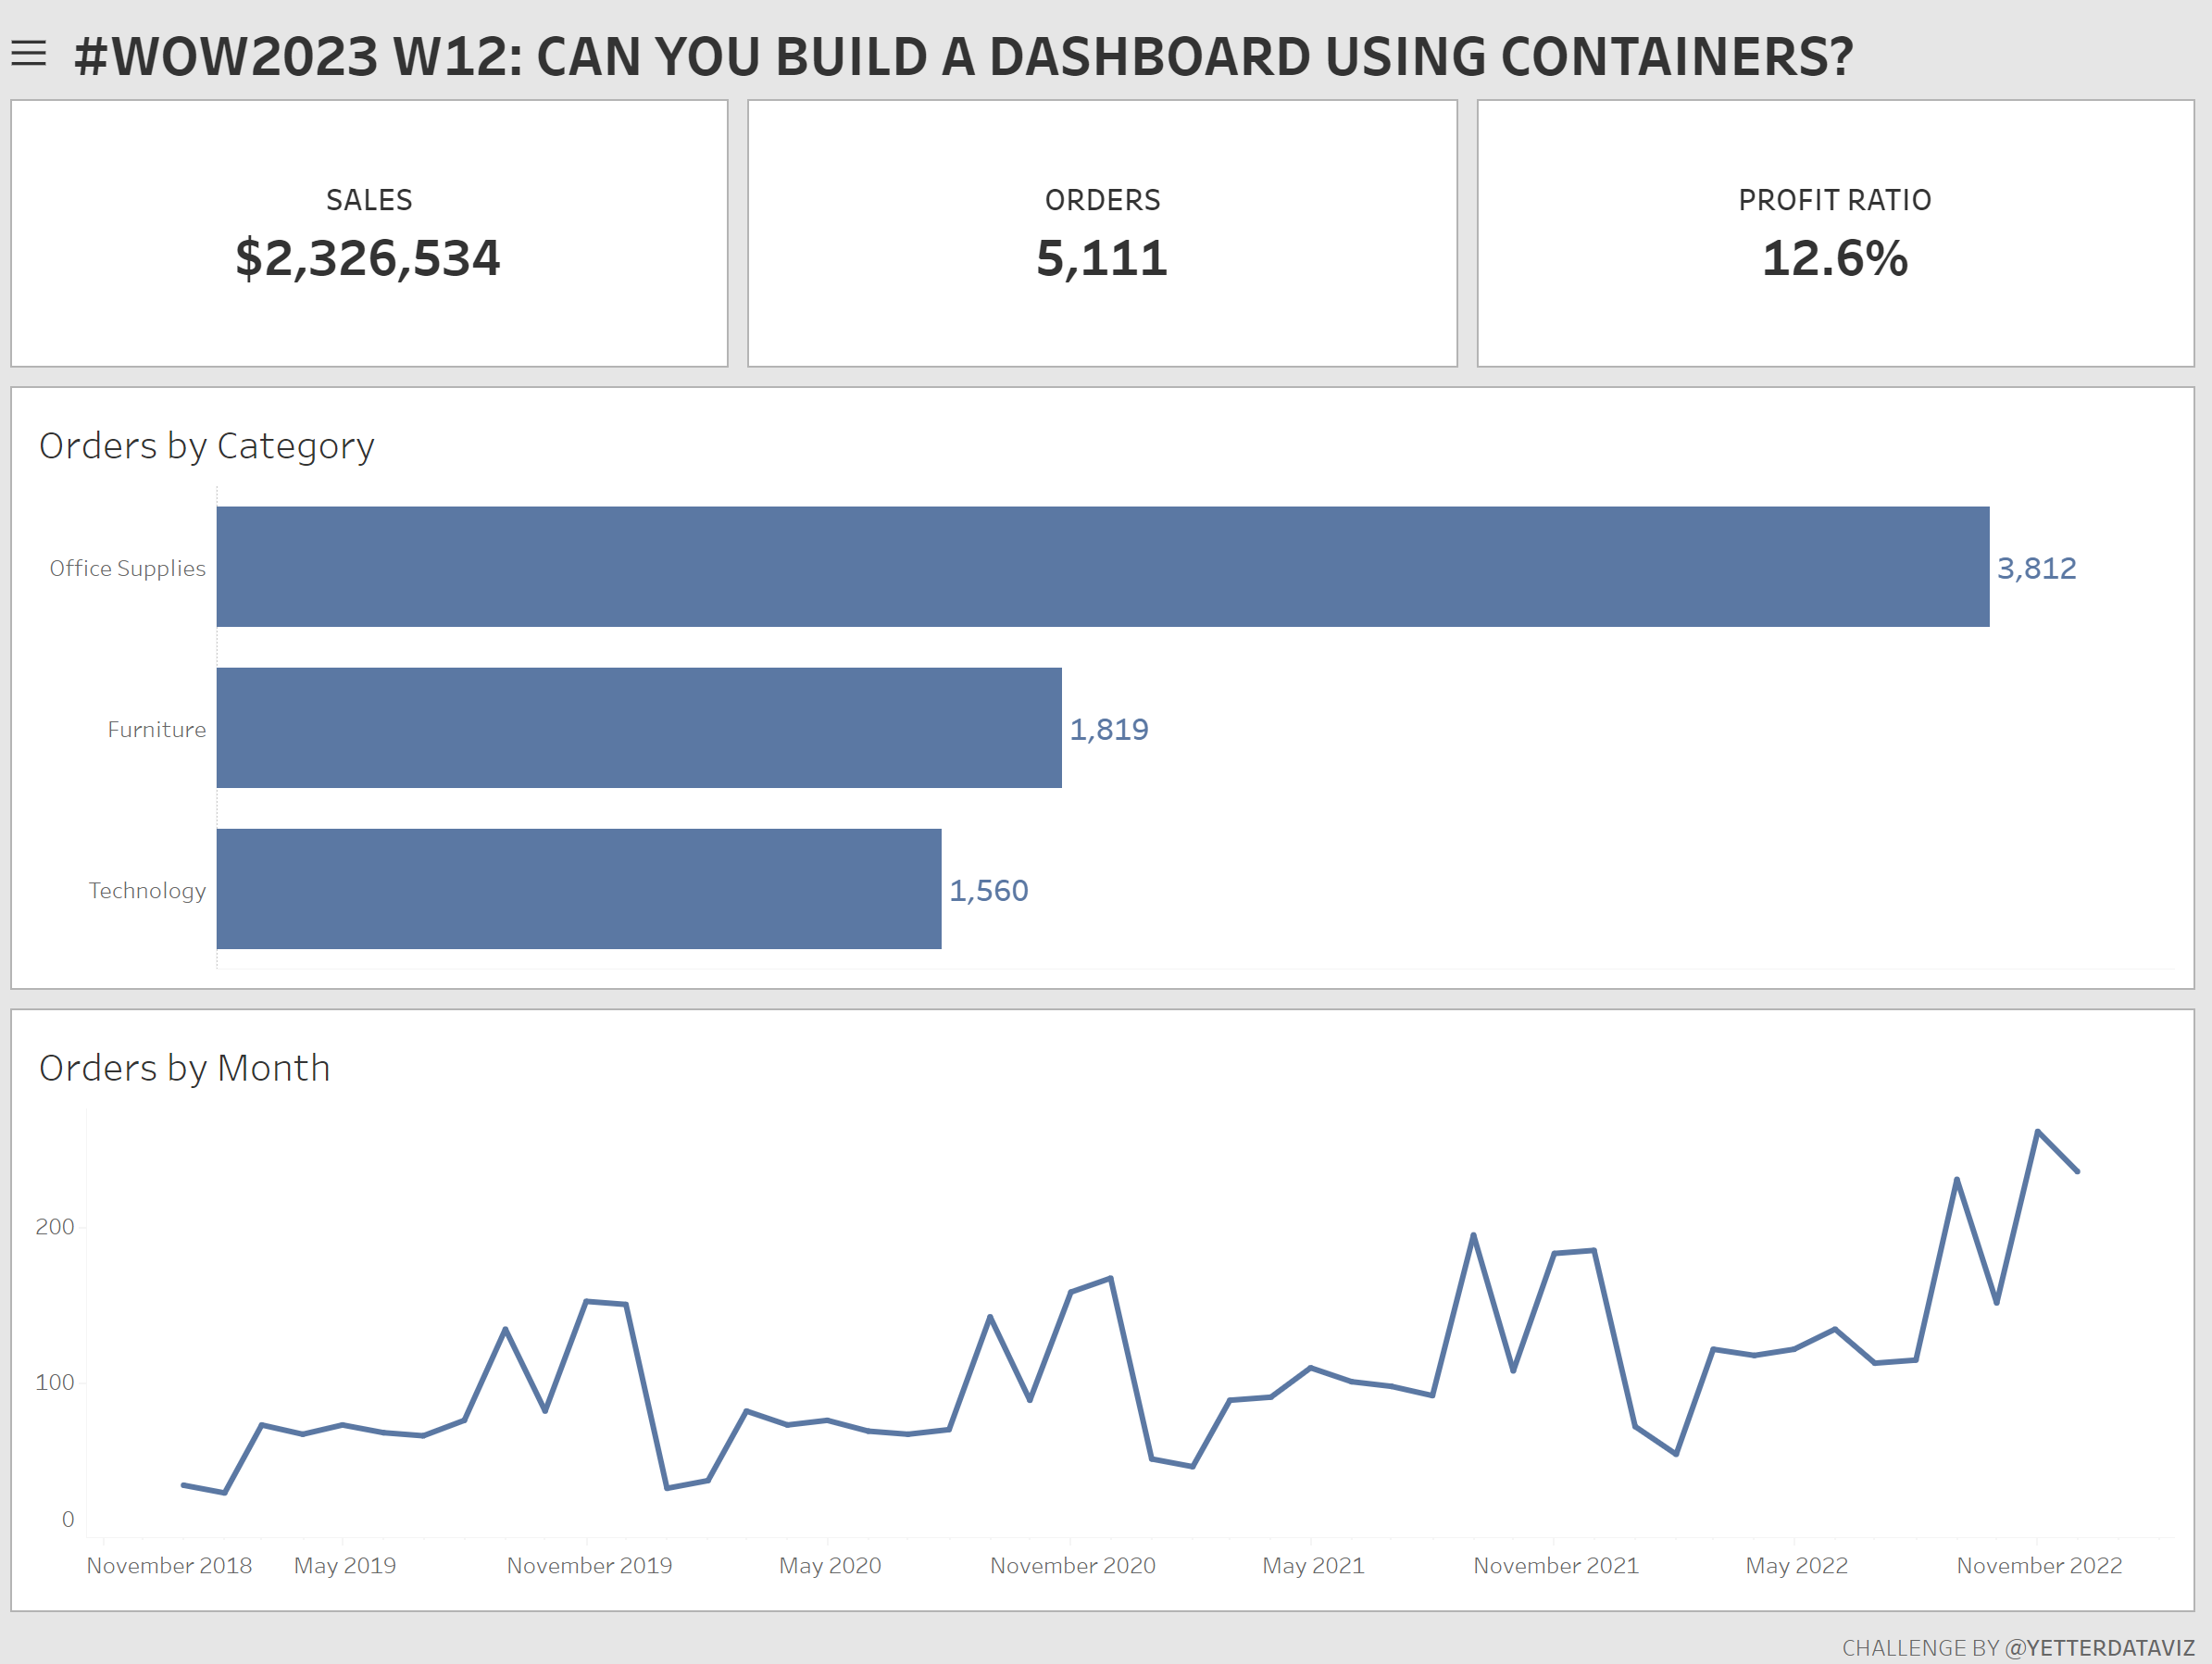
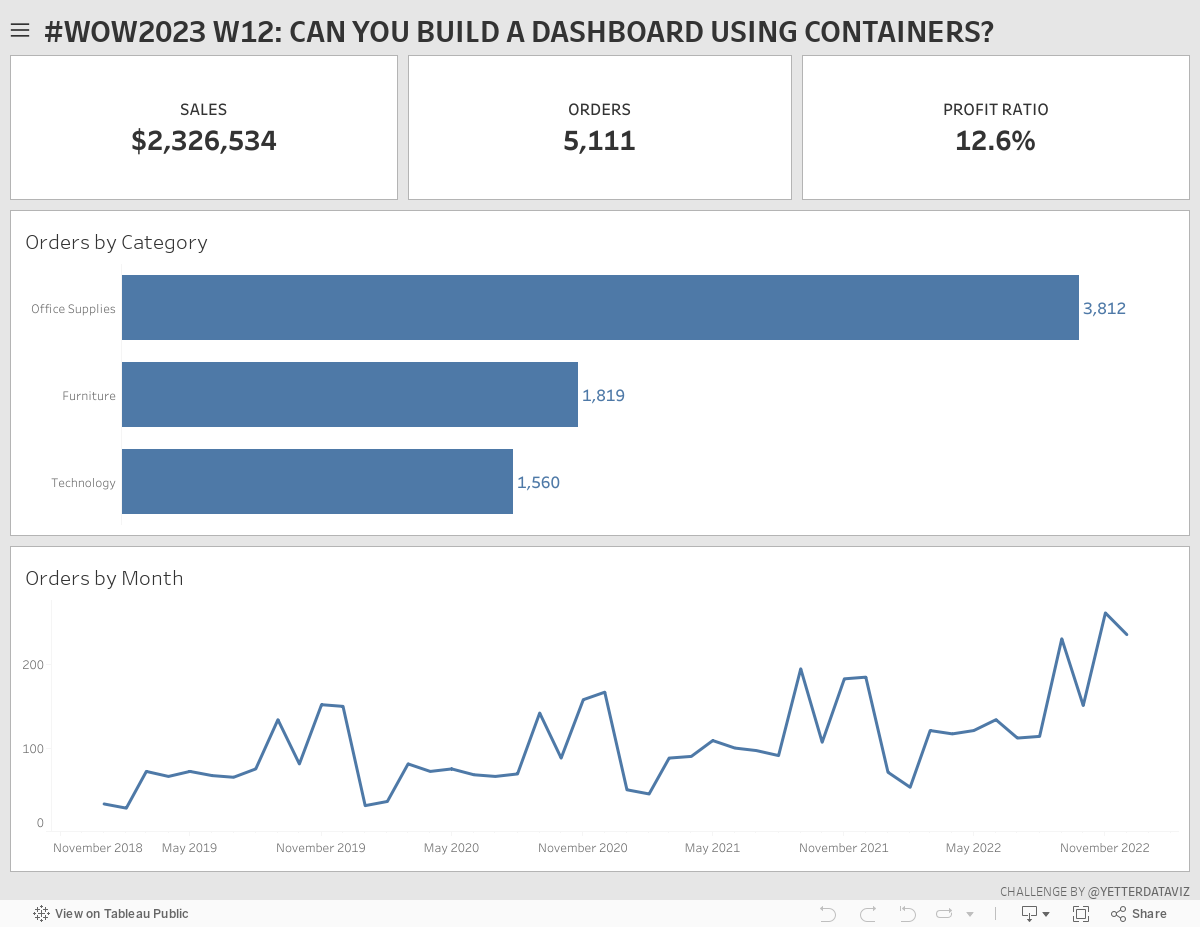
Create a line chart that displays a selected metric (Sales, Orders, or Profit Ratio) by Month
Create a bar chart showing the same selected metric by category.
Create KPI cards for Sales, Orders, and Profit Ratio that, when clicked, change the selected metric for the bar and line charts. (Sheet should not remain highlighted when clicked)
Clicking on a bar should filter the KPI cards and line chart to that category.
Arrange worksheets using containers, with appropriate padding to match the layout
Add a show/hide filter menu with Category and Order Date filters, along with text instructions for actions.
Dataset
This week uses the Superstore data set from 2022.3, but any Superstore version will do.
Attribute
When you publish your solution on Tableau Public make sure to take the time and include a link to the original inspiration. Also include the hashtag #WOW2023 in your description to make it searchable!