Introduction
It’s Community Month once again here at #WOW2023 which means we have a guest coach. I wanted to use this opportunity to connect with our global community. Without a doubt, the most active group of challenge participants I see on Twitter, beyond those in anglophone countries, are the #DataSaber community based in Japan.
I present to you Yusuke Nakanishi, a Tableau certified BI Dashboard Engineer, a teacher (of Tableau) and a regular participant in both Makeover Monday and Workout Wednesday. Yusuke Nakanishi is well on the way to 300 vizzes on Tableau Public. Here’s their challenge for you…
非常に光栄なことにゲスト出題者としてお声がけをいただきました。
私は2021年から本格的にWorkoutWednesdayをはじめとしたTableauコミュニティに参加し、非常に多くのことを学ばせていただきました。
今回は、私が知りうるテクニックの中でも、実用的で気に入っているものをテーマにしたいと思います。
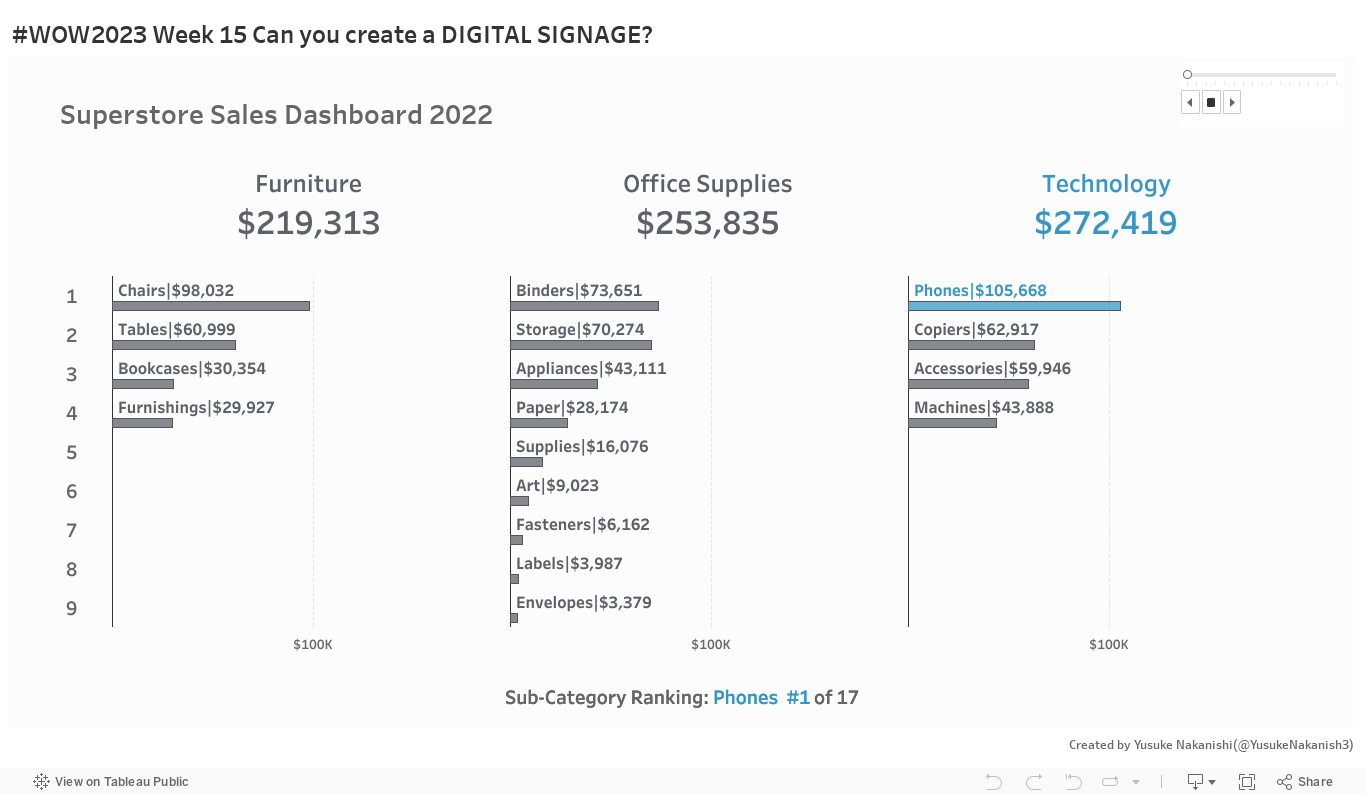
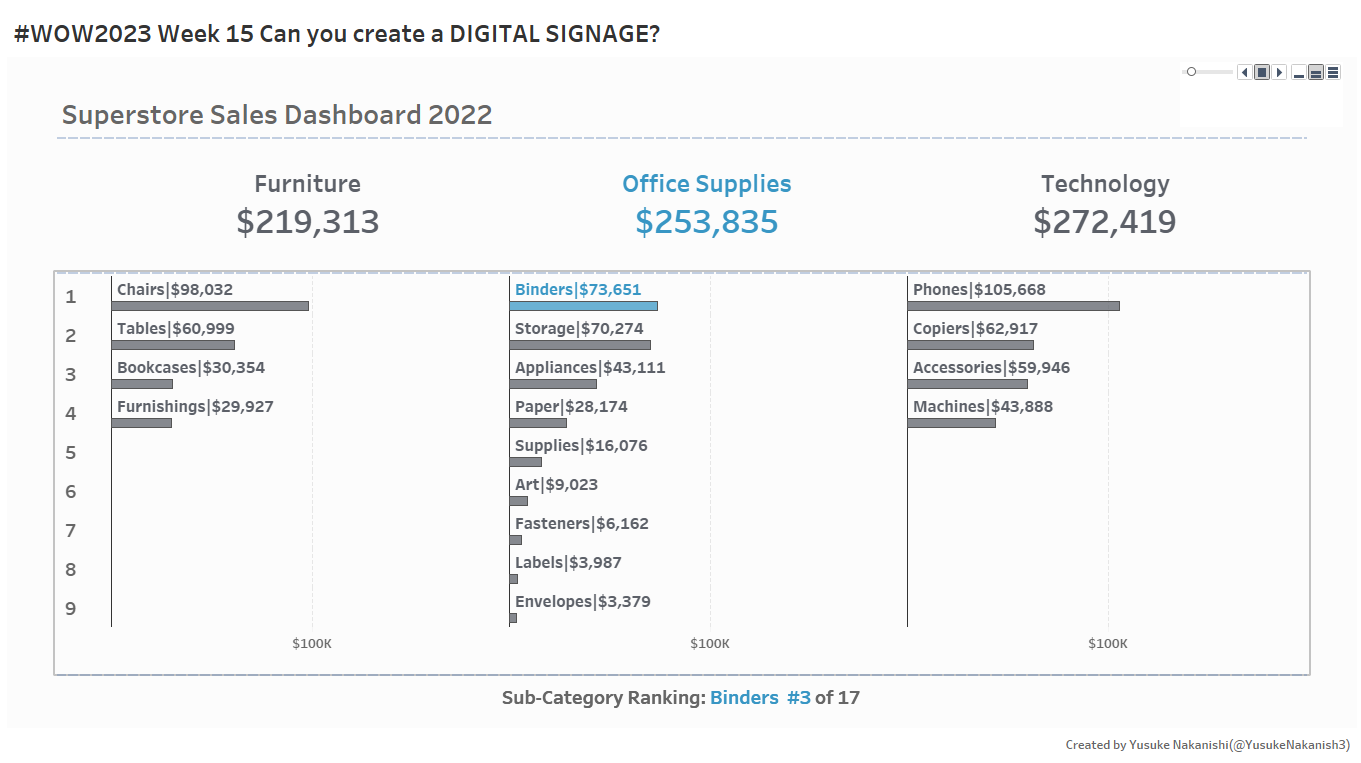
さて、あなたはTableauのダッシュボードをサイネージとして使ったことはありますか?
私は社内でのTableau導入初期に、Tableauの魅力を手軽にアピールする手段として、いくつかのVizをサイネージにして掲示していました。
Vizをサイネージとして使うにあたり、もちろん既存の静的なVizをそのまま利用するのも有効ですが、やはり動きがあったほうが人目を惹くことができます。
素晴らしいことに、Tableauには動きをつけるためのページ機能という便利なものがあります。
今回はこのページ機能を応用し、特定のディメンションのハイライトを切り替えていくVizを作ってみましょう。
ボーナスチャレンジでは、結合や表計算等に関する細かな(でも有用な)テクニックを盛り込んでいます。
是非挑戦してみてください。
Translation
I was very honored to be invited as a guest presenter. Since 2021, I have been actively participating in the Tableau community, including WorkoutWednesday, and have learned a great deal. This time, I would like to use the techniques that I know that are practical and that I like.
Have you ever used a Tableau dashboard as signage? At the beginning of the introduction of Tableau within the company, I posted several viz as signage as a means of easily appealing the appeal of Tableau.When using viz as signage, it is of course effective to use an existing static viz as is, but it is still more eye-catching if there is movement. The cool thing is that Tableau has a handy page feature for making things work.
This time, let’s apply this page function to create a viz that switches the highlights of a specific dimension.
Bonus Challenges include subtle (but useful) techniques for joins, spreadsheets, and more.
Please try it.
Requirements
- 3 sheets
- Dashboard Size: 1366×768 px
- Use data from Jan. 1 to Dec. 31, 2022
- BAN charts of sales by Category
- Create bar charts of sales by Sub-Category
- Category and Sub-Category coloring should change automatically
- NO tooltips
- Colors:As you like
BONUS
・The order of the color changes should be in descending order of sales.
Dataset
This week uses Sample Superstore (version 2022.4). You can find it here on Data.World
Attribute
When you publish your solution on Tableau Public make sure to take the time and include a link to the original inspiration. Also include the hashtag #WOW2023 in your description to make it searchable!

Share
After you finish your workout, share on Twitter and/or LinkedIn using the hashtag #WOW2023 #Tableau and tag @WorkoutWednsday, @YusukeNakanish3 and @_hughej
Solution
Interactive