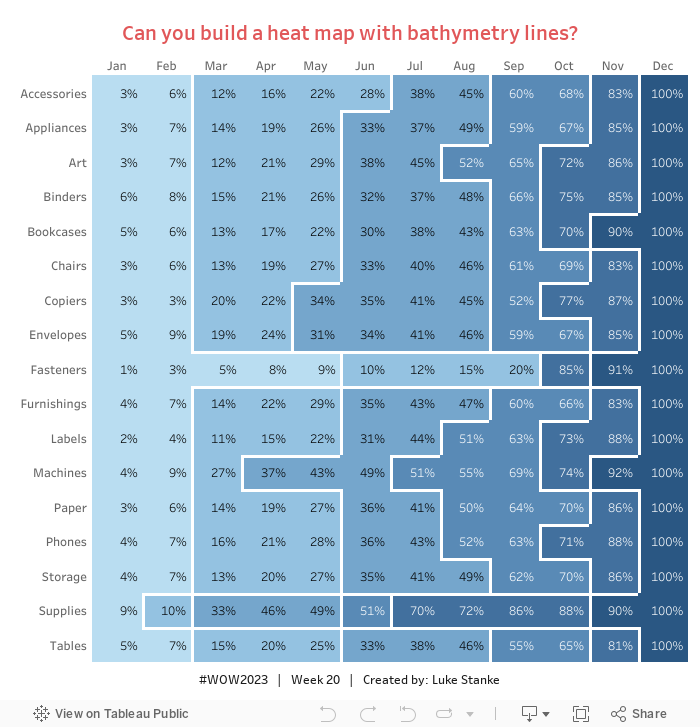
This week, I’m introducing the idea of taking bathymetry or contour lines on maps and placing the lines on heat maps.
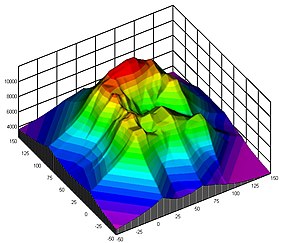
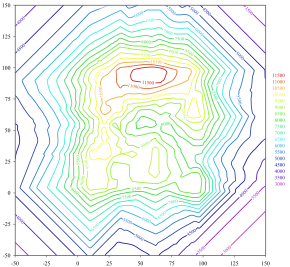
These lines come from identifying the elevation (for contour lines) or depth of water (for bathymetry lines) and creating a map using those values. Here is an example of a contour map from Wikipedia.
You can see the contour based on the height:
and how that is translated to a map:
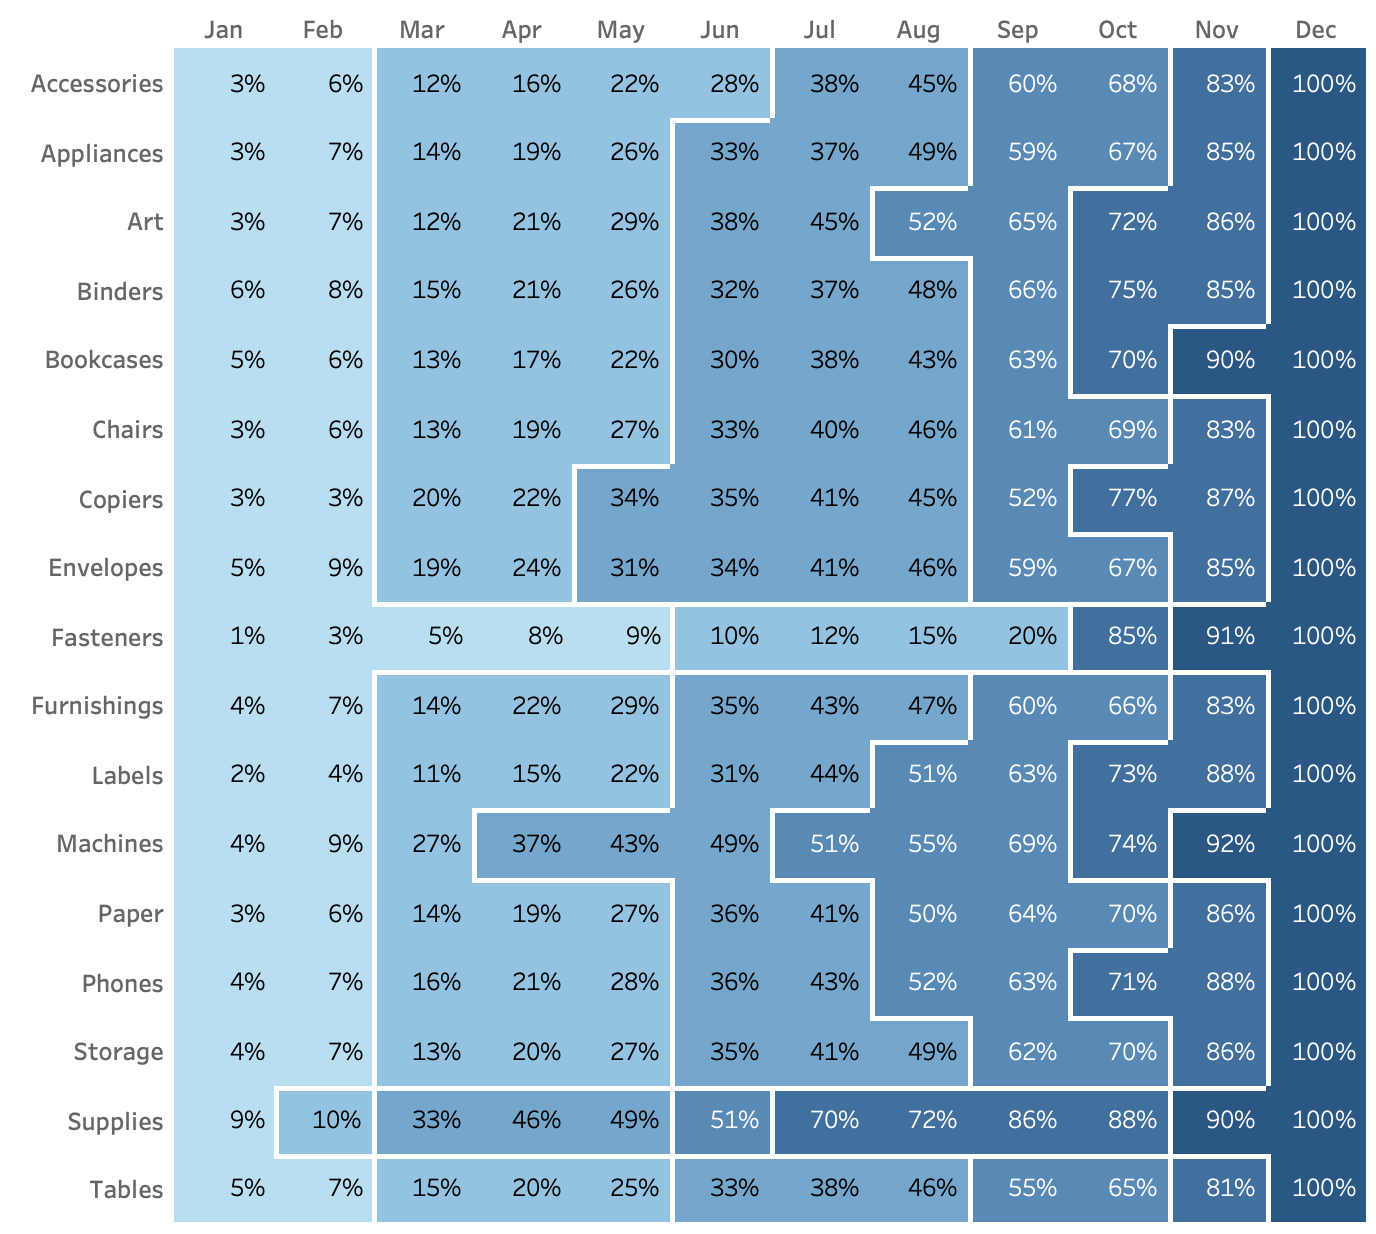
For this example, we are going to take a similar approach in making the a “bathymetry chart” this week. Your goal is to create the lines that divide each part of the heat map.
Create a heat map that shows sales by month and sub-category – you will probably have one cell that shows no value, that’s okay.
For each cell of the heat map show the cumulative percent of total sales for each sub-category (the values should only count up–unless there are returns)
Use the following calc to group your color coding: ROUND([pct_of_total]*50, -1)
For every adjacent cell, if the colors are different, add a line that separates the colors of the two cells.
Turn off tooltips
Match the formatting
ADVANCED: Make sure values return for all cells.
Dataset
This week uses the superstore dataset for Tableau 2022.4. You can get it here at data.world.
Attribute
When you publish your solution on Tableau Public make sure to take the time and include a link to the original inspiration. Also include the hashtag #WOW2023 in your description to make it searchable!