Introduction
I’m so excited to bring this challenge to you live from Tableau Conference 2023 and I get to be the one who created the challenge. I saw something on twitter a while back and wanted to see if I could recreate it in Tableau. This challenge is not as easy as it looks but I hope you have fun. For this week, and this week only I’m going to break this out into sub sections to allow the in person audience hints and tips along the way.
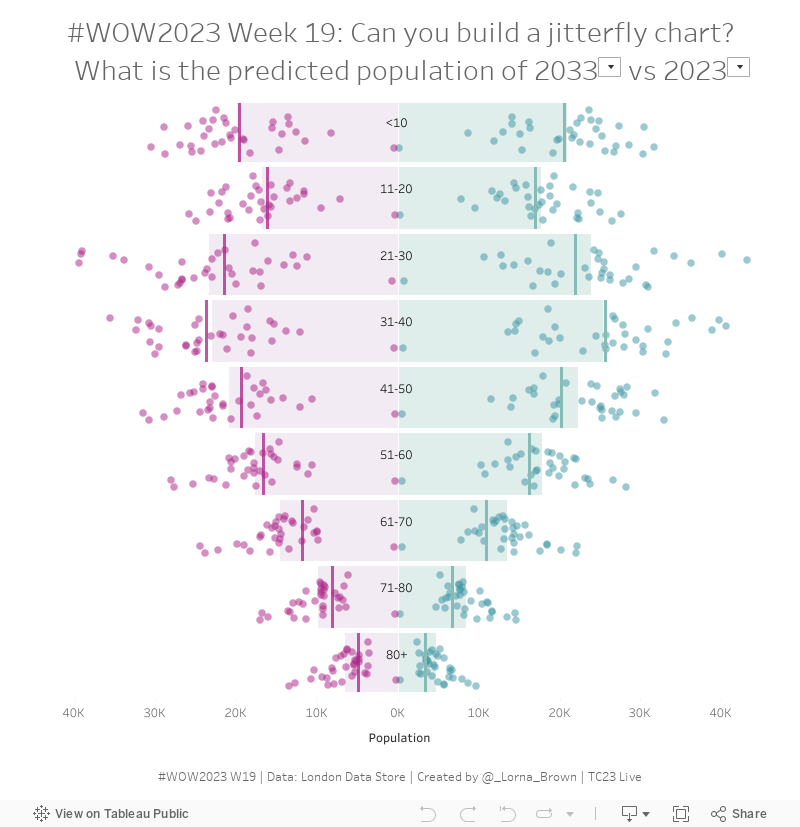
This week, the challenge is to recreate the Jitterfly chart (Jitter & Butterfly). Loving the name thanks to JMac! I’m not expecting everyone to get every single section of this, but there are hopefully many different elements that you can take away and use elsewhere.

Requirements
Firstly an explanation of what you are seeing. Each point represents a district within an age bucket of the primary selected year, the filled in area is the average of the selected year and the Gannt is the comparison year.
Section 1: Data Prep & Calculations
- Create a full data set with Males & Females
- Pivot the data so each row is a year rather than a column
- Give your user the ability to select two years, a Primary & Secondary, can create calculations to isolate those years
- I would also highly recommend creating separate male and female calculations for your two selected years
- Create the age buckets
Section 2: Building the Viz
- Create a jitter plot showing each district for each gender within each age bucket
- Create the shaded section of the primary years average
- Create the reference line to show the comparison years average
Section 3: Formatting
- Choose your own colours or use these shades: Dark Purple #AD2788, Dark Green #4197A4, Fill Purple #F3EBF3, Fill Green #DFEDEB
- Show age buckets in centre of bars
- Match Tooltips
- Make sure all values are positive.
- Dashboard Size: 800 x 800px
HINTS:
- Reference Bands are your friend here!
Dataset
This week uses an old Makeover Monday dataset looking at London Population Predictions. You can find it here on Data.World. Download the Central_trend_2017_base.
Attribute
When you publish your solution on Tableau Public make sure to take the time and include a link to the original inspiration. Also include the hashtag #WOW2023 & #Data23 in your description to make it searchable!

Share
After you finish your workout, share on Twitter and/or LinkedIn using the hashtag #WOW2023 #Tableau and tag @WorkoutWednsday
Solution
Interactive